Live Pulse Streams
This feature is currently in preview mode.
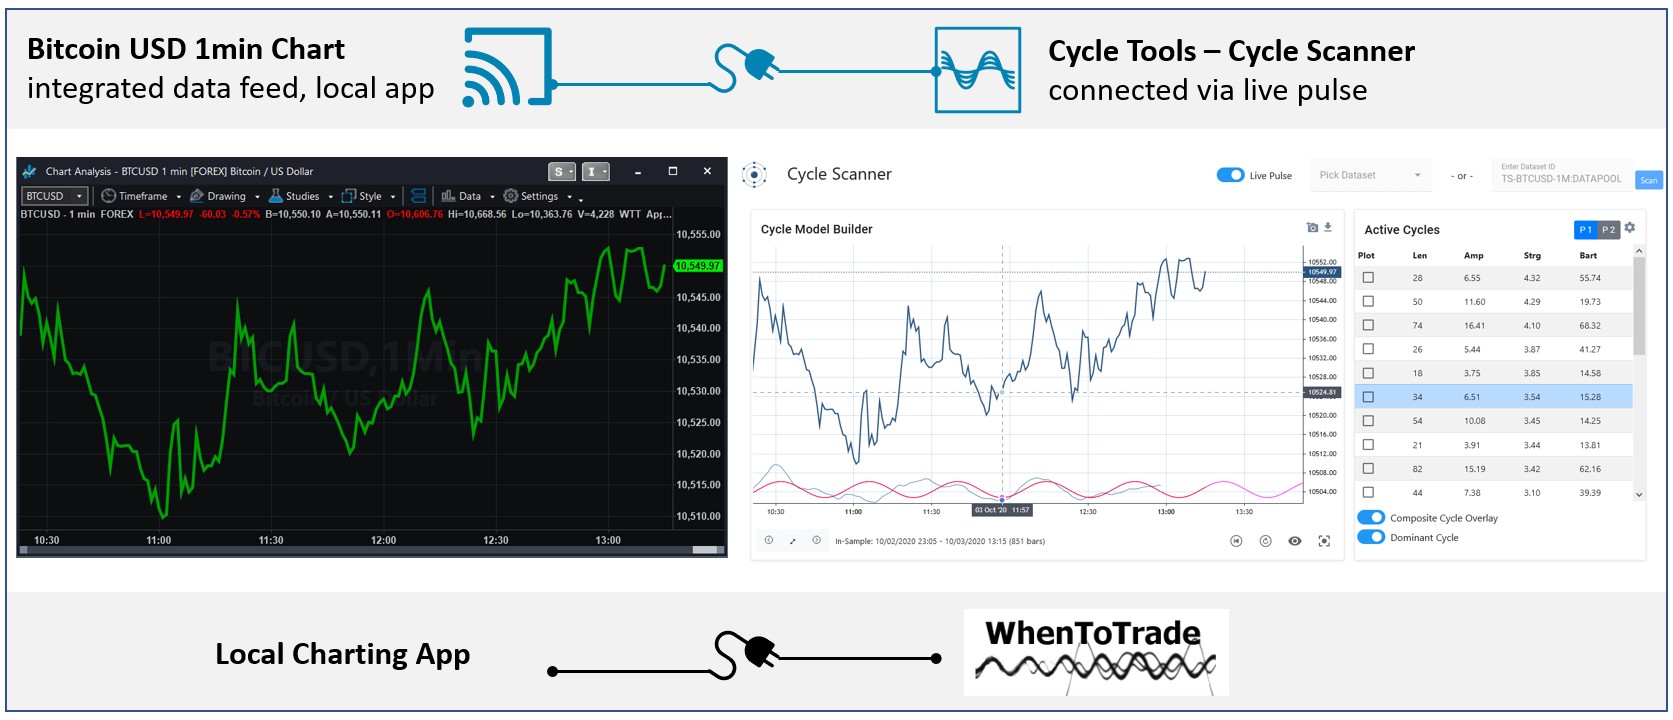
The Live Pulse Streams feature allows you to connect each of your preferred applications with integrated data feeds to the cycle analysis toolbox. Updating and synchronizing data from a local or cloud-based third-party application with the cycle scanner analysis capabilities of our cycle toolbox is done in near real-time. As a result, you can perform near real-time cycle analysis of private data for any data set, time frame, and application.
How does it work?
You start your application as usual and set up your favorite chart, symbol and interval. Next, you run a prepared script and insert it into your application. This script will be executed after new data or a new bar is received. Immediately after receiving, this script will send a new bar to the cycle toolbox for further cycle analysis. You may open a special cycle scanner web window in a browser to see how the dominant cycle is detected and plotted fully automatically.
As a result, you can run your favorite symbols and intervals with your existing data feed, via for example TradeStation or NinjaTrader, and connect live data directly to the cycle analysis toolbox. The Cycle Scanner monitors the arrival of new data and updates the analysis automatically.
The concept is illustrated by the following illustration:
What are the prerequisites?
- A valid cycle tools subscription with an existing API key is required. The API key must be provided when you activate your script in your custom application.
- It is required that you have your own third-party application with its own datafeed (e.g. TradeStation, NinjaTrader).
- Download and install the required scripts for your application.
- When not using the pre-built scripts, you can set up your script to use streams individually based on our Rest API documentation.
How to get started?
The following example shows screenshots from TradeStation. However, the scripts and approach is the same in other applications.
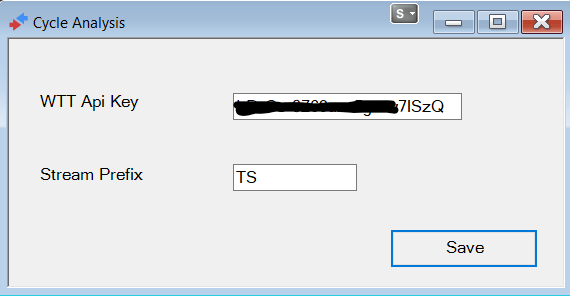
- Open your charting application. Provide the API Key and symbol prefix information in the settings window. As shown here, for Tradestation you enter the Api key into the Cycle Analysis TradingApp window:
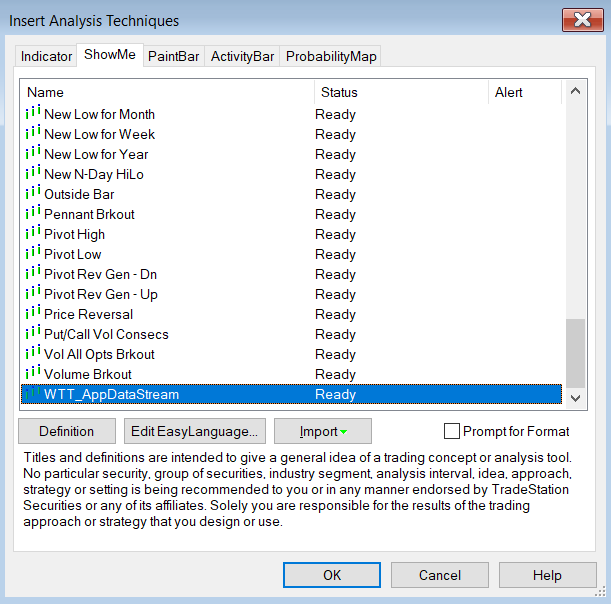
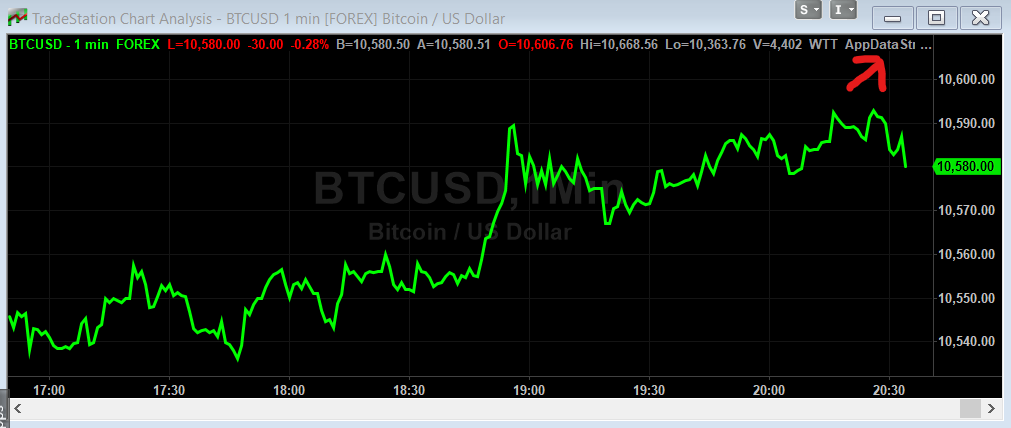
- On a running chart, apply the ShowMe script named "WTT_AppDataStream":

There are no settings for the script. This script will ensure to push and sync the data to the cycles toolbox. The script will use the following convention to create a cycles datafeed ticker id:
[PREFIX]-[SYMBOL]-[INTERVAL][PERIOD]:[USERNAME]
If you have a 1min BTC USD chart running, the live stream will be available on the cycle analysis platform with the tickerid: TS-BTCUSD-1M:[USERNAME]
If no errors or alerts show up, the chart is now connected as live stream to the cycles toolbox.
- Login to the cycles toolbox at cycle.tools and open the "My Streams" section within the "Settings" menu:
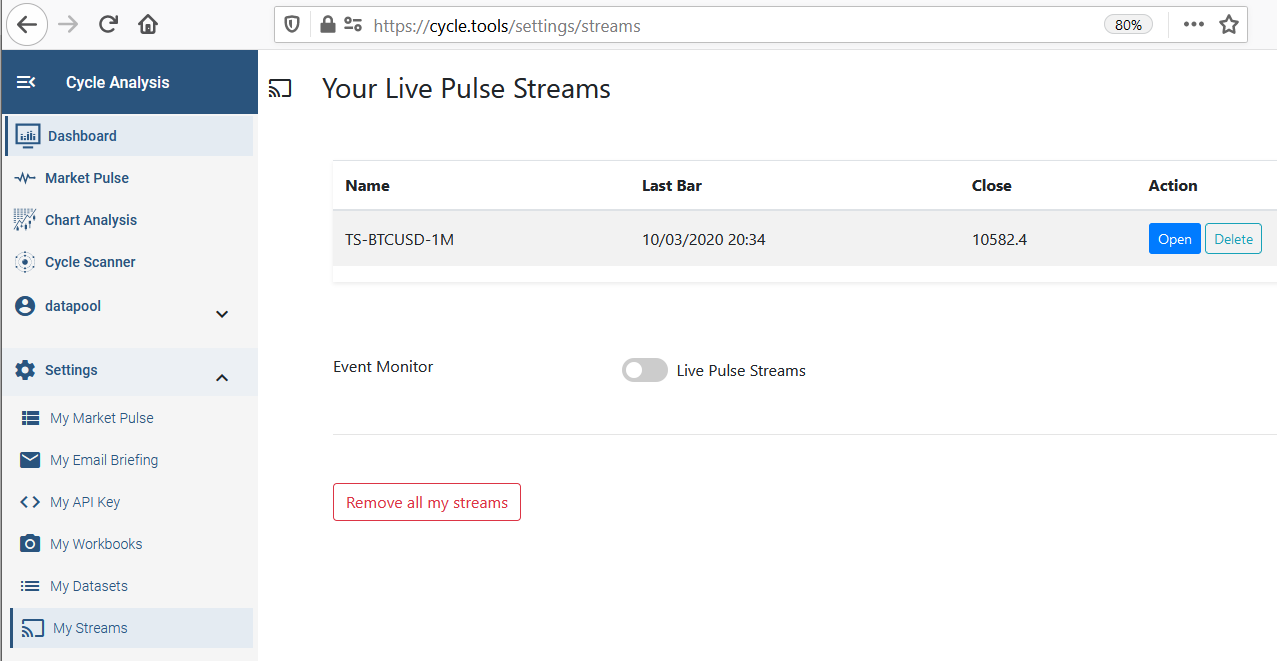
The connected datafeed should show up in the table with the Name Id. You can use the settings panel to monitor incoming events if you enable the Event Monitor with the "Live Pulse Streams" switch. The monitor is only used to show incoming signals for debug reasons. It is not required to enable the Event Monitor. The live sync is working anyhow. - You can now open the cycle scanner for the connected symbol by clicking the "Open" button.

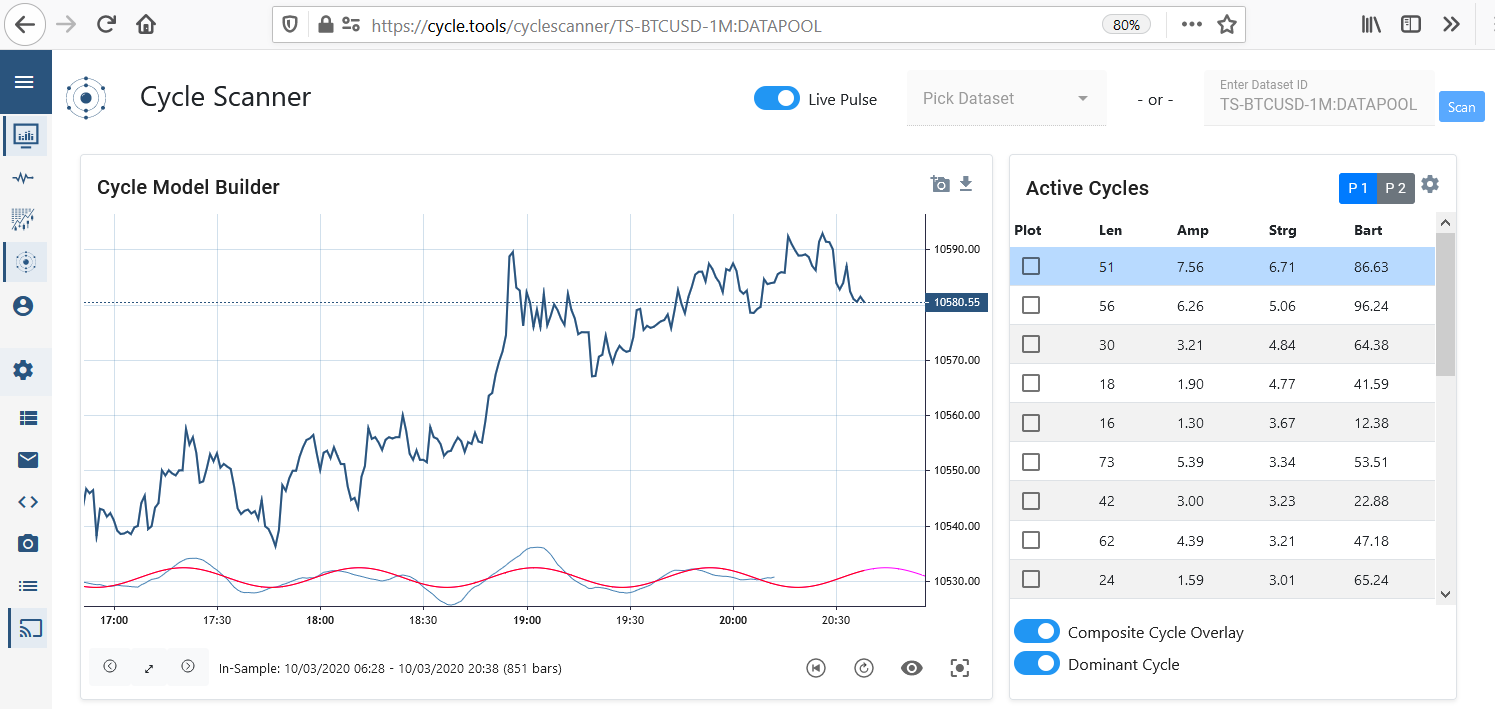
A new page will show up. You just need to enable the stream via the switch "Live Pulse" on the top of the screen. From now on, live data will stream onto the chart when a new bar has been closed in your local charting app. The cycle analysis will automatically be updated. So all active cycles and the spectrum pot will refresh automatically with new data coming in. - Enjoy your live connection between your local app and the cycle scanner app!


Download the pre-build scripts for your platform as attached files to the article.
Current limits:
Analyst Level: 5 running live streams
Pro Level: 20 running live streams