Cyclic Smoothed RSI with MTF trigger period highlighter
The cyclic smoothed RSI MTF indicator is an enhancement of the Relative Strength Indicator "RSI", adding
- additional smoothing without introducing lag and maintaining clear sharp turns for signal generation,
- adaptive upper and lower bands to avoid whipsaw trades and adapt the indicator to trending/cyclic conditions,
- using the current dominant cycle length as input for the indicator to ensure more accurate change in trend signals,
- using higher time-frame csRSI dynamic oversold/overbought conditions to highlight time windows for signal filtering.
This indicator is an advanced version of the public available open-source cyclic smoothed RSI indicator. It offers multi-time-frame period highlighting by using a higher time-frame cyclic smoothed RSI to indicate time periods with high-probability signals.
Overview and Examples
The following chart illustrates how it works and compares it against the basic RSI indicator. The csRSI indicator shows automatic highlighted periods with highlighted red and green time zones. These areas are based on another cyclic smoothed RSI indicator from a higher time-frame. The periods are marked red when the higher time-frame csRSI is above the upper bands and marked green when below the lower dynamic bands.
These colored periods in the indicator panel indicate the time to look for signals from the csRSI indicator. The derived signals are marked on the price chart. While the standard RSI would give too much whipsaw trades as indicated by the questions marks, however. the csRSI MTF version is able to filter the high probability signals while skipping false signals with a clear, objective procedure.
S&P500 EMini Futures - csRSI 2H chart / 1D filter example signals
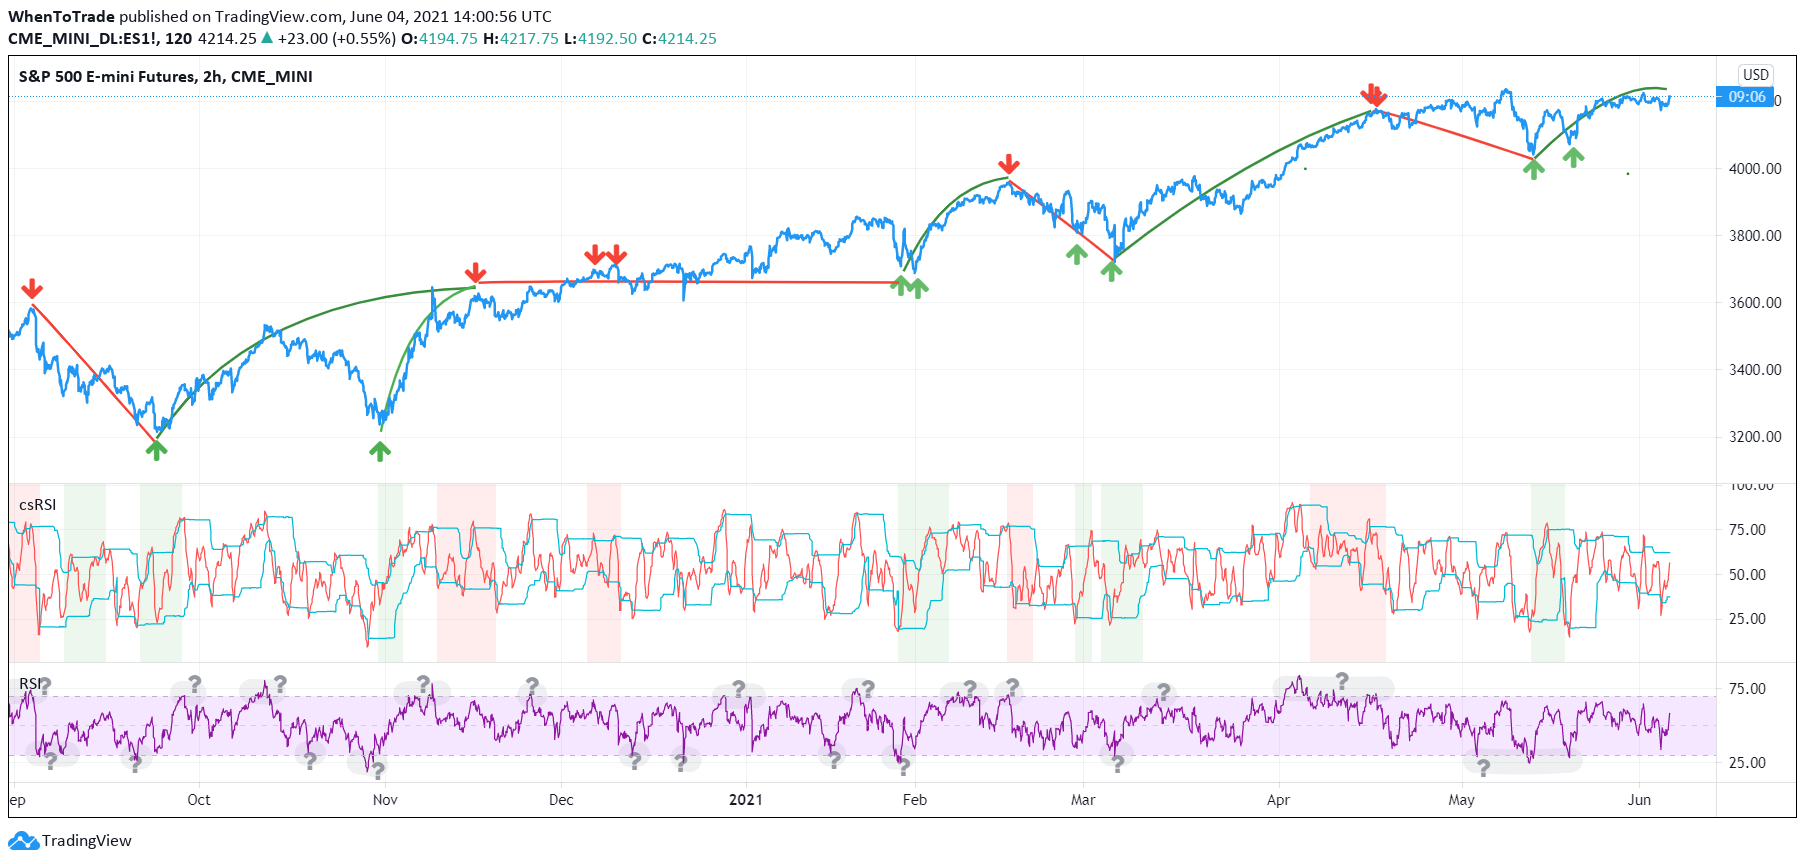
Chart 1: S&P E-Mini Futures 2h chart with daily higher time-frame filtering period for the csRSI, showing the standard RSI in the lower panel for signal comparison, signals from the csRSI are marked on the price chart
Chart Link: https://www.tradingview.com/x/oETacMVR/
Bitcoin BTC/USD - csRSI 2H chart / 1D filter example signals

Chart 2: Bitcoin BTC/USD 2h chart with daily higher time-frame filtering period for the csRSI, signals marked
Chart Link: https://www.tradingview.com/x/h407gPQm/
EUR/USD Forex - csRSI 20min chart / 2h filter example signals
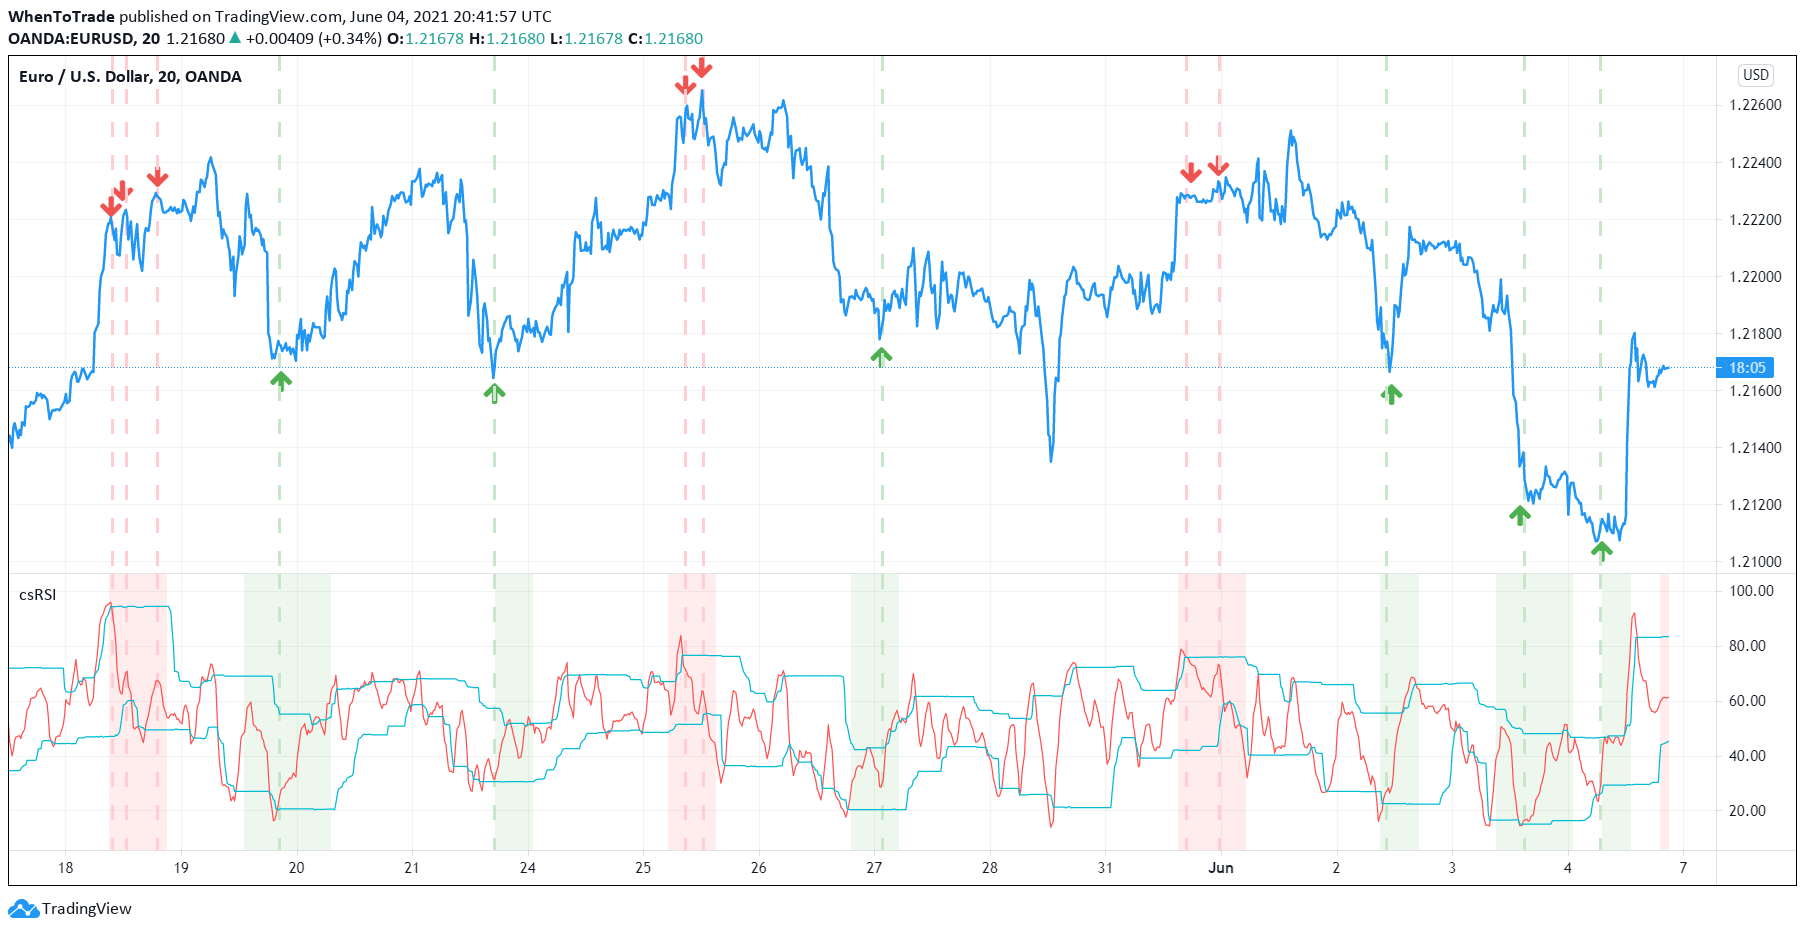
Chart 3: Bitcoin BTC/USD 20min chart with 2H higher time-frame filtering period for the csRSI, signals marked
Chart Link: https://www.tradingview.com/x/zx66TIpJ/
Info:
All three examples are setup with the basic standard settings and no additional parameter adjustments. The placed arrows on the price/indicator panel and the projection price areas have been added manually to visualize where the signals are derived based on standard technical indicator oscillator readings (signal turn above/below bands). Due to the nature of the indicator (ultra-smooth, sharp turns, dynamic bands), these signals are easily seen without any whipsaw. (please zoom in)
Features
Zoom-The following chart is a close-up of the EUR/USD example above and shows the forex pair on a 20-minute time frame for the continuous period May 23, 2021 to May 27, 2021. The normal RSI is also plotted for comparison. Since the normal RSI would give too many unclear signals marked with "?", the csRSI first filters the high probability time frames according to the integrated multi time frame filter from the 2h chart. In (Exampleaddition, 3)the smooth indicator line allows very precise detection of turns and divergences using the adaptive bands. In the 4-day period shown, there were 2 clear buy and sell signals. The normal RSI would not have been able to filter the wrong signals from the right ones.
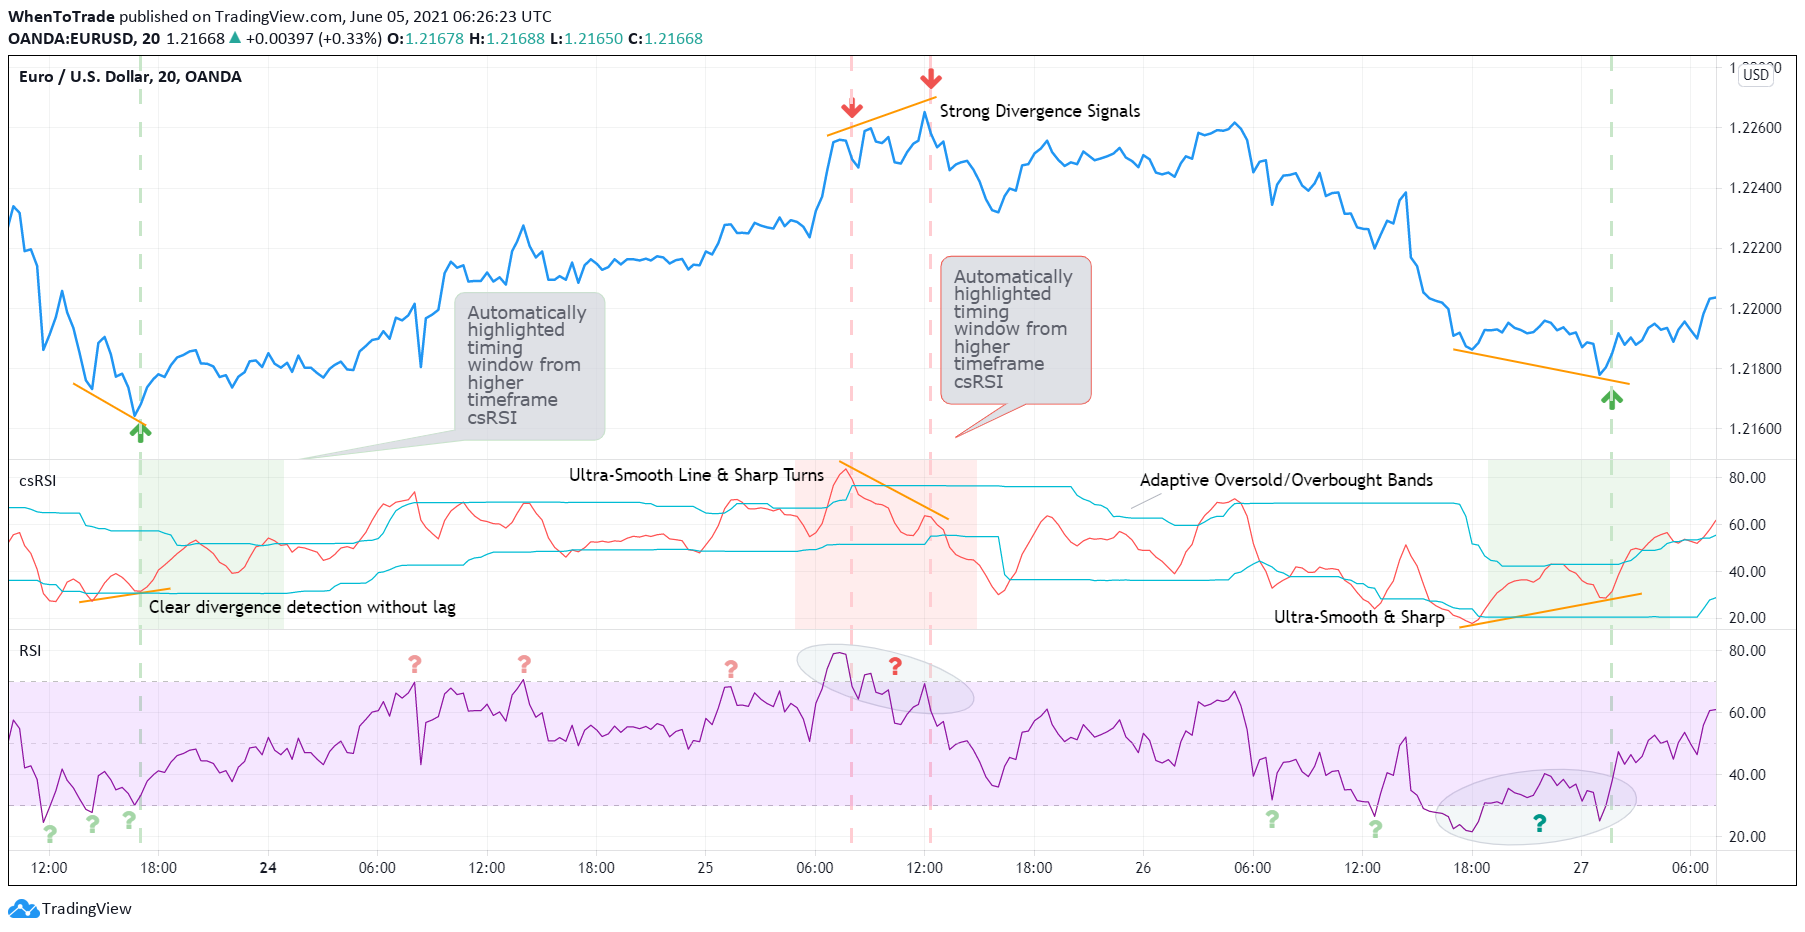
Link: https://www.tradingview.com/x/T3YBEZKx/ekN6ULpq/
Multi-Time-Frame filtering
...
Ultra-smooth indicator
.... (without lag)
Dynamic adaptive bands
.....
Cycle-tuned sharp signals
....
Settings
Theses are the settings used for both examples shown above. The first allows you to select the timeframe for the indicator signals. We recommend keeping that according to your chart timeframe. The cycle length allows to improve the signals by entering the dominant cycle length of the analyzed dataset. This is optional if you dont know the current dominant cycle. In that case, leave it at 20. If you know the current dominant cycle length, it can help to improve the indicator signal generation. The examples shown above have not been optimized by using the dominant cycle length.
The MTF CYCLE FILTER area is used to set the time-frame used as filter to plot the colored indicator background in red and green when the higher time-frame indicator is above (red) or below (green) the dynamic bands. These indicates the time-windows with high probability signals on the trading chart time-frame to look our for signals on the indicator line.
