Dynamic Cyclic Smoothed RSI with MTF trigger period highlighter
This indicator is an advanced version of the public available cyclic smoothed RSI indicator. It offers multi-time-frame period highlighting by using a higher time-frame cyclic smoothed RSI to indicate time periods with high-probability signals.
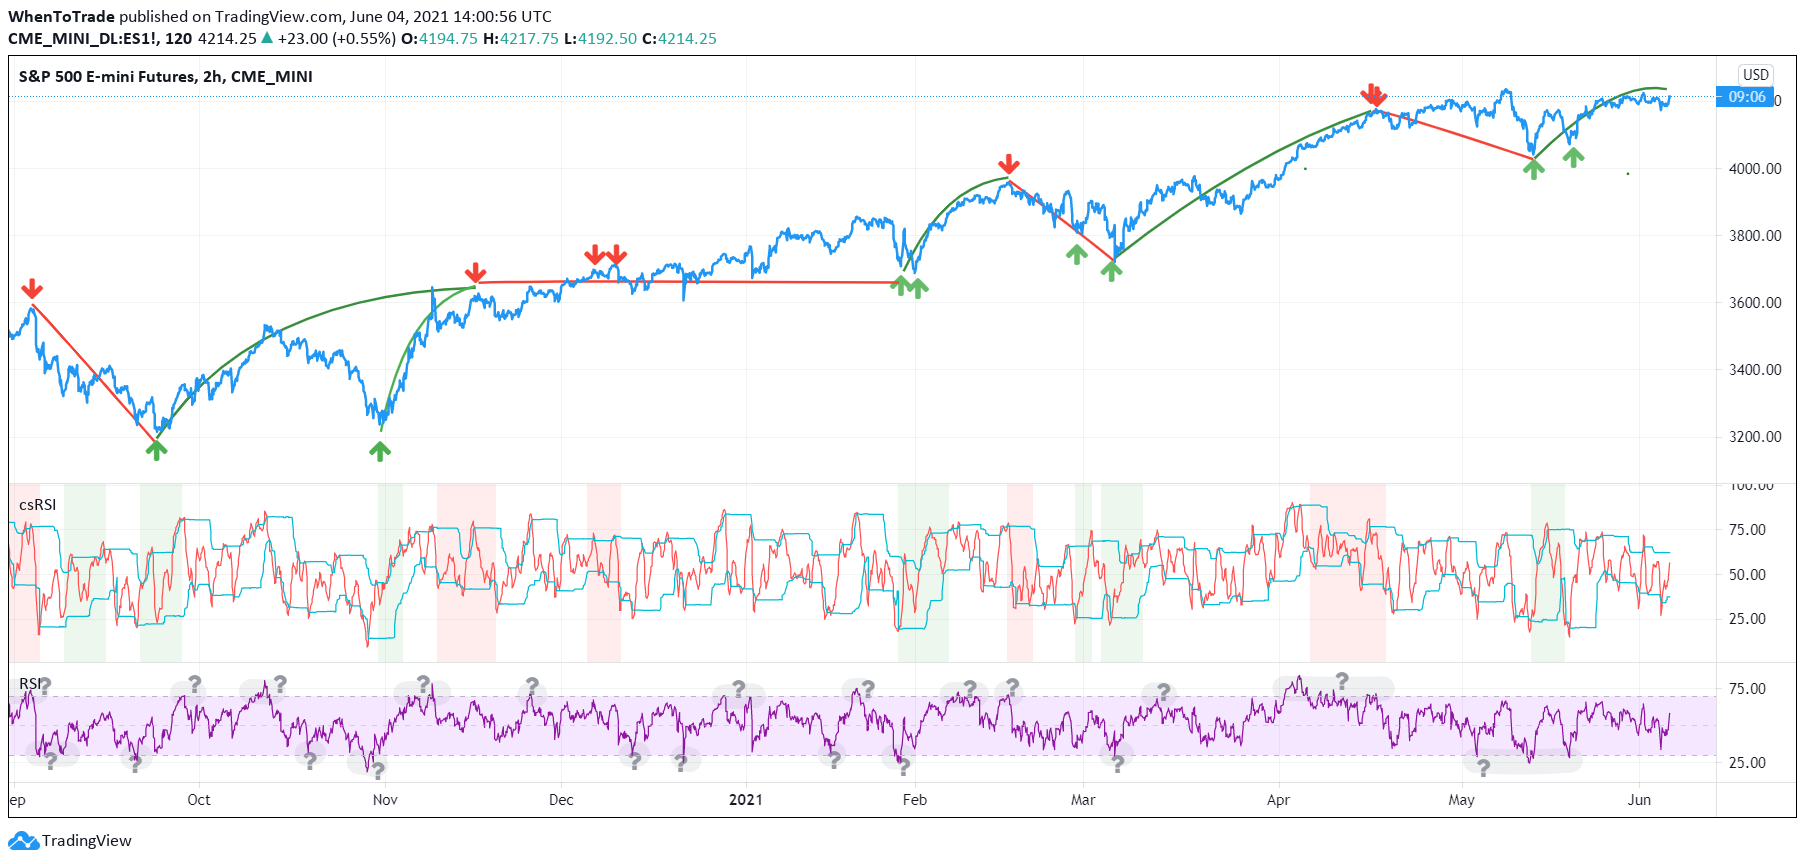
The following chart illustrates how it works and compares it against the basic RSI indicator. The csRSI indicator shows automatic highlighted periods with highlighted red and green time zones. These areas are based on another cyclic smoothed RSI indicator from a higher time-frame. The periods are marked red when the higher time-frame csRSI is above the upper bands and marked green when below the lower dynamic bands.
These colored periods indicate the time to look for signals from the shown csRSI indicator plot. Using turns above or below the bands to create trading signals as marked on the price chart.