Cyclic Smoothed RSI Indicator
The cyclic smoothed RSI indicator was first introduced in the book "Decoding the Hidden Market Rhythm Part 1: Dynamic Cycles" (LINK) and the indicator code has been made public for different charting platforms.
Main Features:
- Signal and dynamic oversold/overbought calculation according to the dominant cycle length to keep the signal line better in sync with the current market cycle
- Ultra-Smooth indicator signal without additional lag (zero-lag indicator)
- Adaptive bands to better adjust oversold/overbought areas to market phases (trending/cycling)
- Better divergence detection to spot strong signals
For more information, please read the referenced book Chapter 4 "Fine tuning technical indicators". (Amazon link)
Our TradingView indicator version is available as public Open-Source indicator in their public library. If you want to use this indicator on your chart, use the "Indicators" button from the TradingView chart panel.
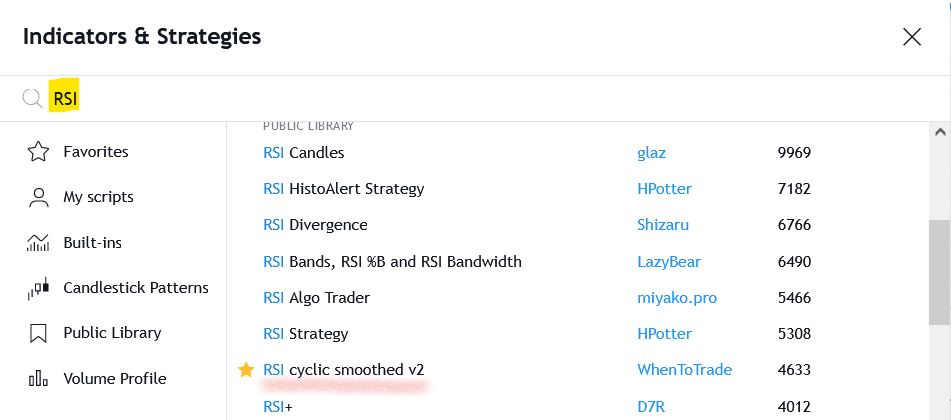
Search for "RSI" in the "Indicators" window and select the "RSI cyclic smoothed v2" from WhenToTrade as indicator.
You can also open the source code and adjust for your own needs. The script page with code is available via this link at TradingView: https://www.tradingview.com/script/TmqiR1jp-RSI-cyclic-smoothed-v2/
This is an improved technical indicator and can be used as drop-in replacement for the classic RSI. The basic applications of technical analysis for oscillators and the Relative Strength Index apply. This indicator is not designed for use as an automated trading strategy. The script is intended for use in discretionary trading.