Asymmetric Business Cycles and Cycle Skewness
The business cycle is a fundamental concept in macroeconomics. The economy has been characterized by an increasingly negative cyclical asymmetry over the last three decades. Studies show that recessions have become relatively more severe, while recoveries have become smoother, as recently highlighted by Fatas and Mihov. Finally, recessive episodes have become less frequent, suggesting longer expansions.
As a result, booms are increasingly smoother and longer-lasting than recessions.
These characteristics have led to an increasingly negative distortion of the business cycle in recent decades. An extensive literature has examined in detail the statistical properties of this empirical regularity and confirmed that the extent of contractions tends to be sharper and faster than that of expansions. The explanation of this pattern presents a challenge to the existing standard symmetric 2-phase cycle models. A theory is needed to cope with this. For this purpose, we design and estimate a dynamic skew cycle model that includes a skew factor.
The following illustration shows on the left side a classical, symmetrical 2-phase cycle (green). An asymmetrical 3-phase cycle (red) is highlighted on the right side. For modelling a simplified formula is used, which allows different distortions of the phases with a skew factor but at the same time keeps the length of the whole cycle, from peak to peak, the same without distortion.
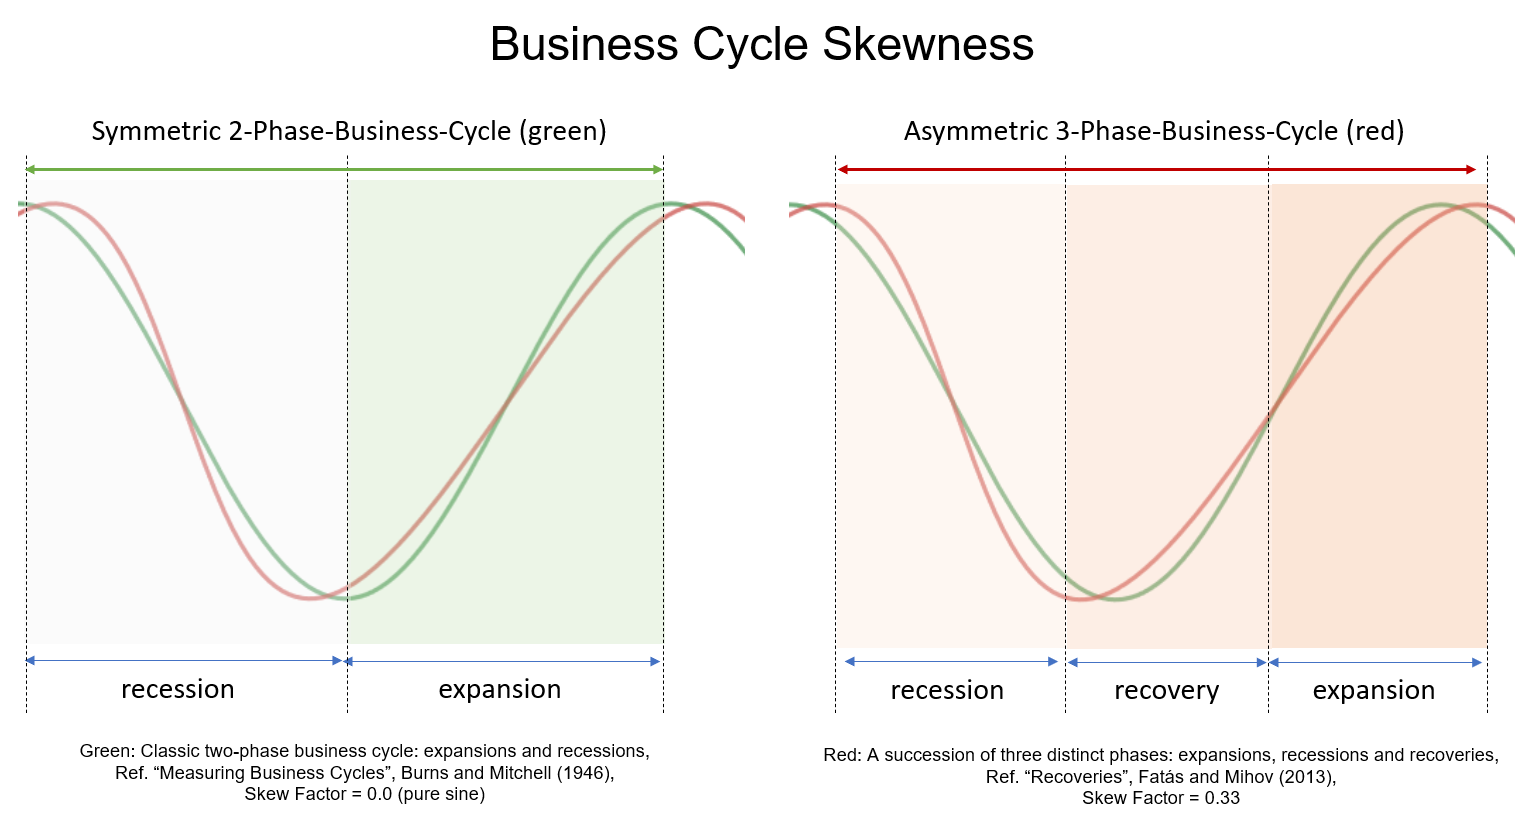
The skew factor of 0.33 used in the red model shows that the upswing phase is twice as long as the recession, while ensuring the same total duration and amplitude of the standard 2-phase cycle model (green). This allows us to transfer identified cycle lengths and strengths to the 3-phase model for modeling.
Cycle Skew
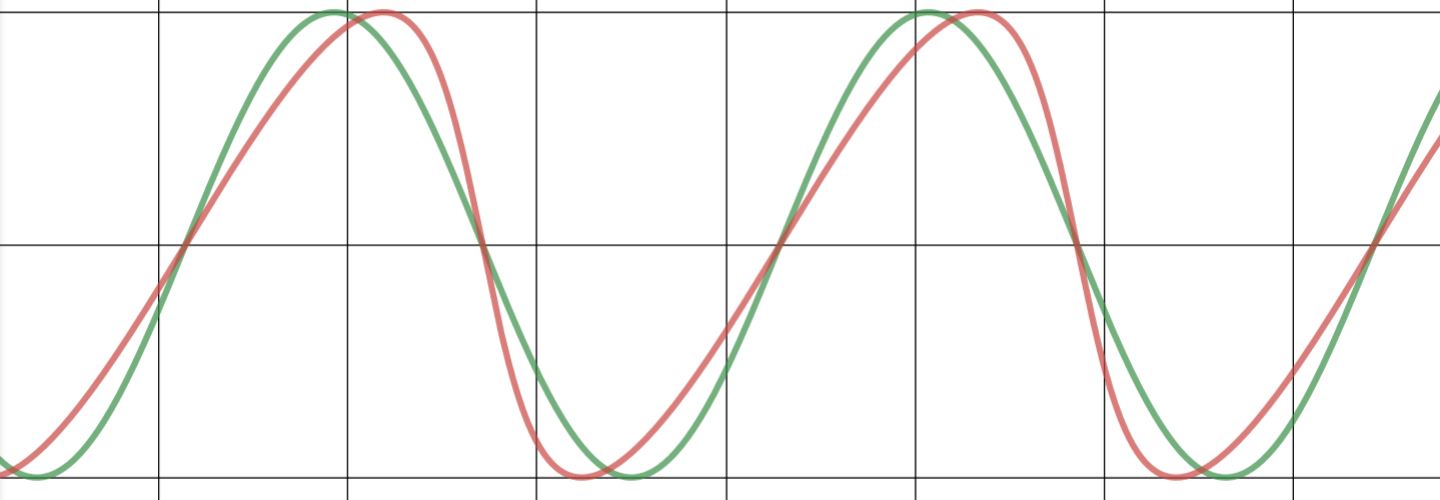
The introduced 'skew factor' allows the representation of an asymmetric shape for business cycles in a cyclic model as shown in the following examples. The green cycle is a standard sine-wave cycle compared to a skewed red cycle model with a specific skew factor.
Examples

skew = +0.25
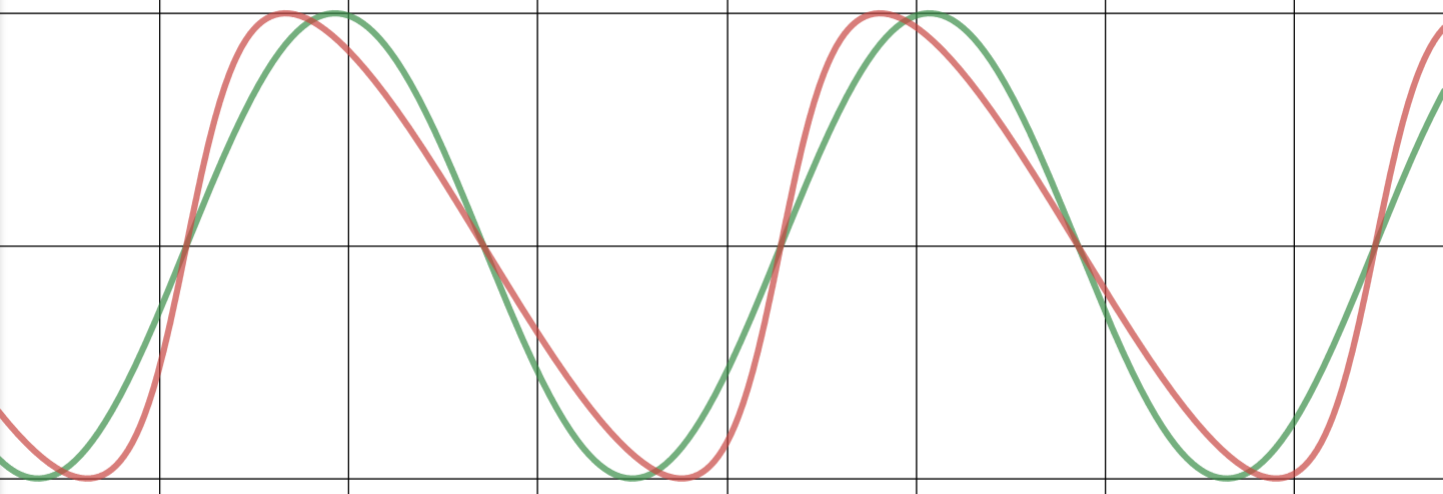
skew= +0.5

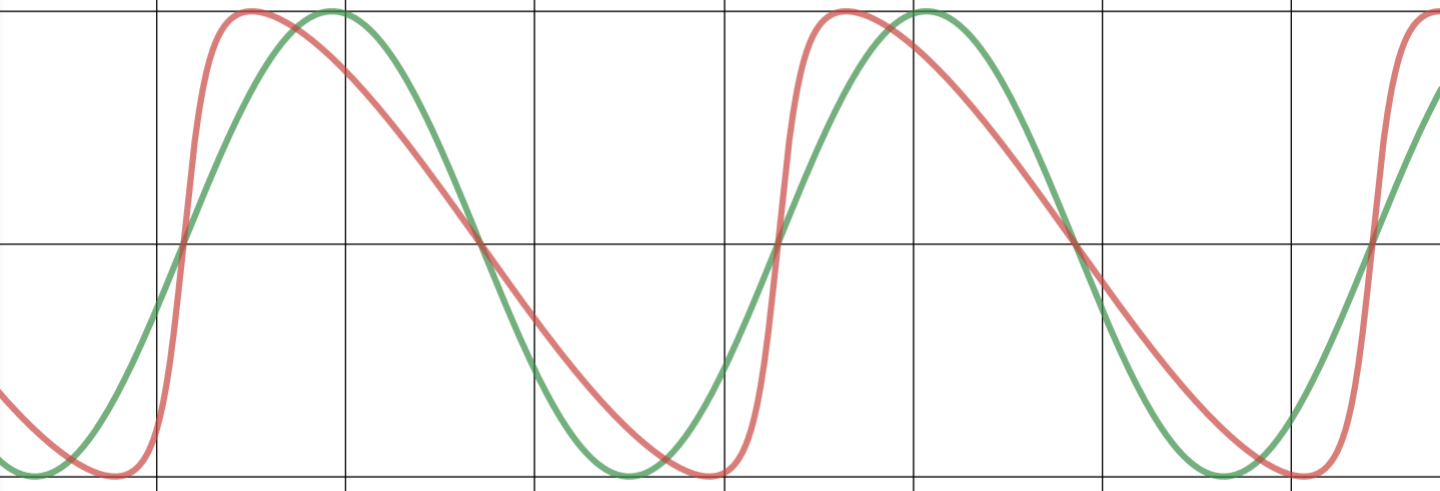
skew=+0.75

skew = - 0.25
skew = - 0.5
skew = -0.75
(a+cosx)cosn+bsinxsinn(a+cosx)2+(bsinx)2
Desmos interactive playbook: https://www.desmos.com/calculator/ejq06faf93
Math Equation
To apply the cycle skew, the cycle skew equation is used instead of a pure sin(x) formula:

Where:
a = skew factor [Range: -1 ... +1]
b = 1.0
n = PI / 2
x = phase
Math LaTeX Code:
\frac{(a+\cos x)\cos n+b\sin x\sin n}{\sqrt{(a+\cos x)^2+\left(b\sin x\right)^2}}
.NET C# code:
double SkewCycle(double x, double a)
{
  double b = 1.0;
  double n = Math.PI / 2;

  double cycle_numerator = (a + Math.Cos(x)) * Math.Cos(n) + b * Math.Sin(x) * Math.Sin(n);
  double cycle_denominator = Math.Sqrt(Math.Pow((a + Math.Cos(x)), 2) + Math.Pow((b * Math.Sin(x)), 2));
  double skewedCycle = cycle_numerator / cycle_denominator;

  return skewedCycle;
}
Further Reading
- "Skewed Business Cycles" (2020)
https://nbloom.people.stanford.edu/sites/g/files/sbiybj4746/f/skewness_0.pdf - "The Asymmetric Business Cycle" (2012)
https://www.mitpressjournals.org/doi/10.1162/REST_a_00169 - "Leverage and Deepening Business Cycle Skewness" (2017)
https://web.econ.ku.dk/esantoro/images/Skewness.pdf - Fatas and Mihov (2013), "Recoveries"
https://www.bostonfed.org/employment2013/papers/Fatas_Mihov_Session7.pdf
(a+cosx)cosn+bsinxsinn(a+cosx)2+(bsinx)2