Excel Workbooks
How to use cycle analysis with Microsoft Excel via the Cycle Tools API
Get Dominant Market Cycles in Excel
The MarketCycles API endpoint allows you to do dominant cycle analysis for stocks, index data, forex and commodities without the need to subscribe for data-feeds and complex tooling integration. The endpoint gives you all dominant cycle information, including full time-series charting data with a single call.
To get you started quickly, we provide here a short Excel sheet which allows to pull up dominant cycle information and to plot the chart with cycle as indicator. Exactly as you do it with charting software. However, here without the need for any charting tool or any datafeed subscription.
We just use the PowerQuery functions available in Excel to connect to external data-sources. There are two sheets prepared:
The first sheet allows you to specify the symbol/market to analysis and to change the parameters for the request. The update button refreshes the data and the table below shows the detected dominant cycle data.

On the right hand side of the Excel window, you can see two prepared queries using our GET MarketCycles API endpoint. If you are interested in the settings and query parameter, you can do a right-click on the query and select “Edit”. The “Advanced Editor” button shows you the detailed power query. You can see how the table “Parameter” is used to get the parameter to web source URL call.

The second sheet is a prepared chart view for the retrieved time-series with the price, dominant cycle and price-cycle-highligther:

This example demonstrated the power of decoupling our back-end from the front-end. This way, we can provide cycle analysis via our API and you decide which front-end software to use to analyze cycles. You can use the attached Excel sheet as starting point to expand your own analysis dashboards!
You can download the attached Excel Workbook WTT_MarketCycles to play with this example on your own. The API key is just for demo purposes and limited to allow free test. Please get your personal API key if you want to work with this endpoint.
Analyze yourYour own data series for active CyclesData
The CycleScanner API endpoint allows you to post your individual dataset to our cycles engine and receive the analyzed cycles. The prepared Excel workbooks includes a running example with a sample dataset in sheet "dataset". You can change and put your data series in from any source. Once your copied your data, the "CycleScanner" sheet allows you to post the data directly from Excel to our API and receive the results in the lower section of the window:
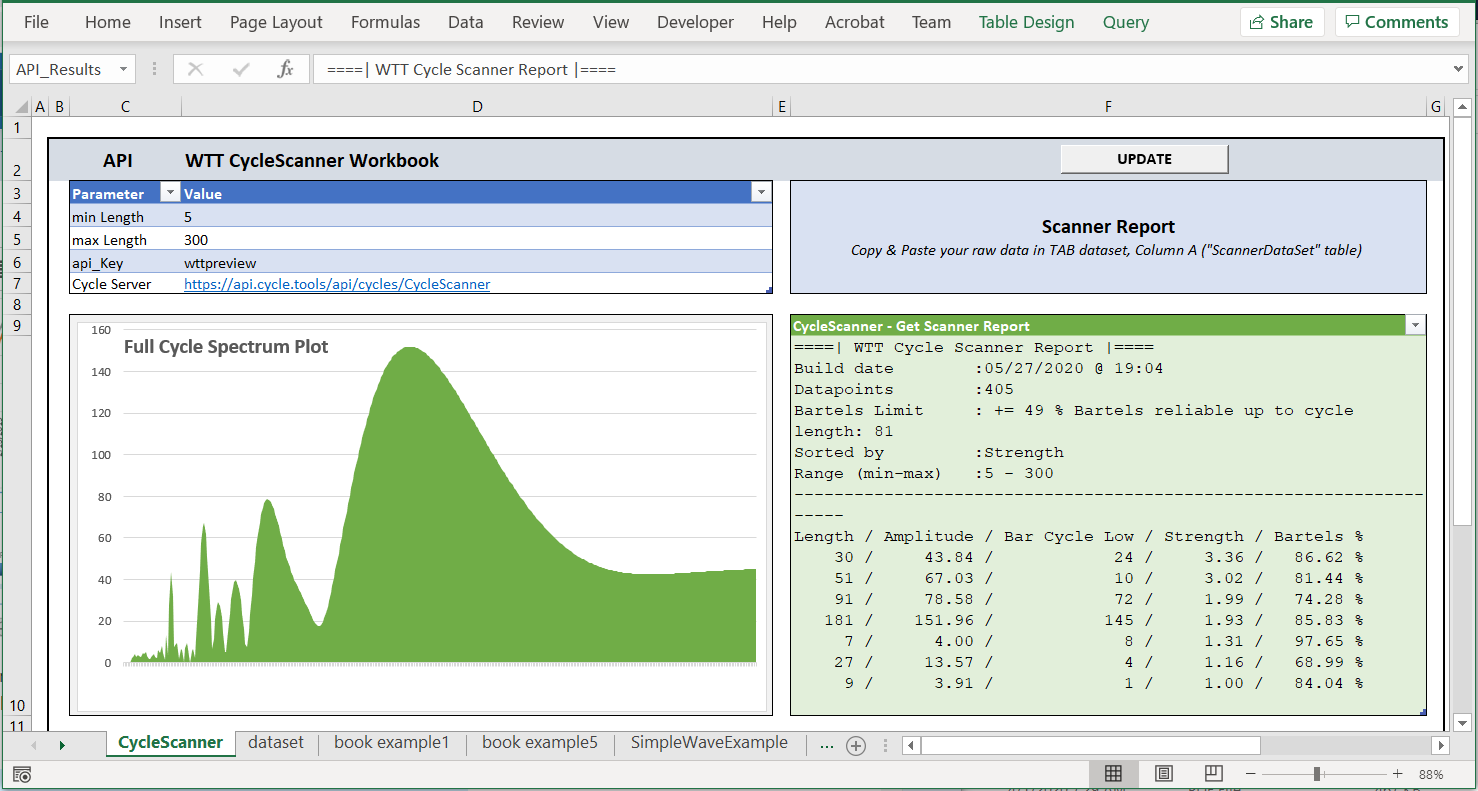
The left panel visualizes the returned results in a simple spectrum graph. The right panel shows the detected cycles in the dataset as a sorted table.
This playbook allows a quick start to get a full spectrum analysis for any data-series with a simple Excel workbook. The playbook is pre-filled with our example no. 5 from our book "Decoding The Hidden Market Rhythm - Part 1".
Please download the attached Excel workbook "WTT_CycleScanner_Workbook". Keep in mind the embedded API key is just for demo and test purposes.