The TradingView script to plot the vector as indicator on the chart is available for public usage here: [https://www.tradingview.com/script/OqeEKITd-WTT-Composite-Cycle-Plotter/](https://www.tradingview.com/script/OqeEKITd-WTT-Composite-Cycle-Plotter/)
You can add this script to your favorite indicators to apply it to your charts: [](https://docs.cycle.tools/uploads/images/gallery/2021-06/image-1624694480305.png)If you are looking for the MotiveWave version of this Composite Cycle Vector plot, please download the [MotiveWave integration pagage here](https://docs.cycle.tools/books/cycle-tools-integration-packages/page/download-motivewave-package "Download MotiveWave Package").
--- ##### ##### How to transfer your composite plot to TradingView chart: **1. Create your composite plot in the cycle app and click the highlighted icon in the Composite Cycle Model Builder window:** [](https://docs.cycle.tools/uploads/images/gallery/2021-06/image-1624693982018.png) **2. A window will open to inform you to copy the vector to your clipboard:** [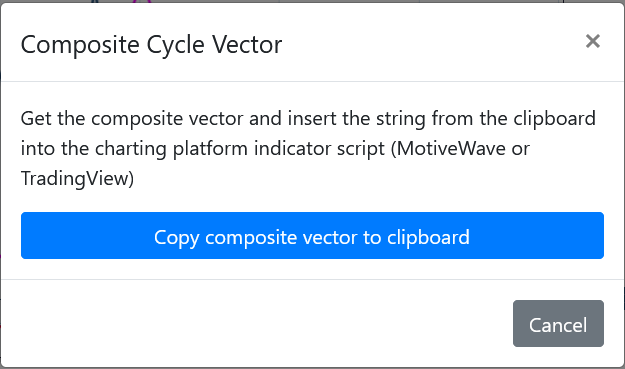](https://docs.cycle.tools/uploads/images/gallery/2021-06/image-1624694060687.png) **3. You can mark the TradingView indicator as "favorite" so it will appear in your list of favorite indicators:** [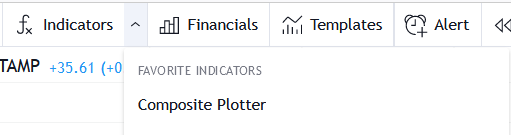](https://docs.cycle.tools/uploads/images/gallery/2021-06/image-1624694271689.png) **4. Once applied to the chart paste the string into the "Composite Vector" field.** Ensure to remove all existing content in the field before you paste your new data. [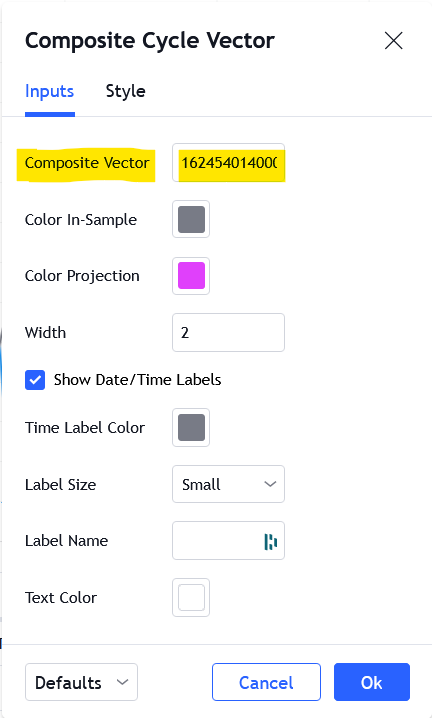](https://docs.cycle.tools/uploads/images/gallery/2021-06/image-1624694342596.png)