Public & Open Source Cycle Indicators
Free and open source versions of our cycle indicators for TradingView
Detrended Rhythm Oscillator (DRO)
The purpose of this indicator is to visualize and check if there is a common rhythm or beat in the dataset of interest.

Chart: 120m Bitcoin chart visualizing the dominant rhyhtm of 40/80 bars with the DRO indicator
TradingView chart: https://www.tradingview.com/x/WYBQLz9D/
Direkt link to TradingView Indicator:
https://www.tradingview.com/script/nzvqcuSh-Detrended-Rhythm-Oscillator-DRO/
Overview and Background
A common way to capture the current dominant cycle length is to detrend the price and look for common rhythms in the detrended series. A common approach is to use a Detrended Price Oscillator ( DPO ). This is done in order to identify and isolate short-term cycles.
A basic DPO description can be found here.
Improvements to the standard DPO
The main purpose of the standard DPO is to analyze historical data in order to observe cycle's in a market's movement. DPO can give the technical analyst a better sense of a cycle's typical high/low range as well as its duration. However, you need to manually try to "see" tops and bottoms on the detrended price and measure manually the distance from low-low or high-high in order to derive a possible cycle length.
This indicators adds the following improvements:
1) Using a DPO to detrend the price (can be turned on or off)
2) Indicate the turns of the detrended price with a ZigZag lines to better see the tops/bottoms
3) Detrend the ZigZag to remove price amplitude between turns to even better see the cyclic turns ("rhythm")
4) Measure the distance from last detrended zigzag pivot (high-high / low-low) and plot the distance in bars above/below the turn
Now, you we can clearly see the rhythm of the dataset indicated by the Detrended Rhythm Oscillator including the exact length between the turns. This makes the procedure to "spot" turns and "measure" distance more simple for the trader.
How to use this information
The purpose is to check if there is a common rhythm or beat in the underlying dataset. To check that, look for recurring pattern in the numbers. E.g. if you often see the same measured distance, you can conclude that there is a major dominant cycle in this market. Also watch for harmonic relations between the numbers. So in the example above you see the highlighted cluster of detected length of around 40 and 80. There three numbers all have a harmonic relation to 40.
Once you have this cyclic information, you can use this number to optimize or tune technical indicators based on the current dominant cycle length. E.g. set the length parameter of a technical indicator to the detected harmonic length with the DRO indicator.
Disclaimer:
This is not meant to be a technical indicator on its own and the derived cyclic length should not be used to forecast the next turn per se. The indicator should give you an indication of the current market beat or dominant beats which can be use to further optimize other oscillators which require length settings as input pararmeters.
Cyclic Smoothed RSI Indicator
The cyclic smoothed RSI indicator is an enhancement of the classic Relative Strength Index (RSI). The cyclic smoothed RSI indicator was first introduced in the book "Decoding the Hidden Market Rhythm Part 1: Dynamic Cycles" (LINK) and the indicator code has been made public for different charting platforms.
It helps to avoid the noisy signal of the RSI with static oversold/oversold areas, usually leading to many false trade signals and thus to many whipsaw trades. The csRSI therefore provides a much cleaner, zero-lag signal line with adaptive bands to help identifying better trade signals.
Advanced Features
- Signal and dynamic oversold/overbought calculation according to the dominant cycle length to keep the signal line better in sync with the current market cycle
- Ultra-Smooth indicator signal without additional lag (zero-lag indicator)
- Adaptive bands to better adjust oversold/overbought areas to market phases (trending/cycling)
- Better divergence detection to spot strong signals
For more information, please read the referenced book Chapter 4 "Fine tuning technical indicators". (Amazon link)
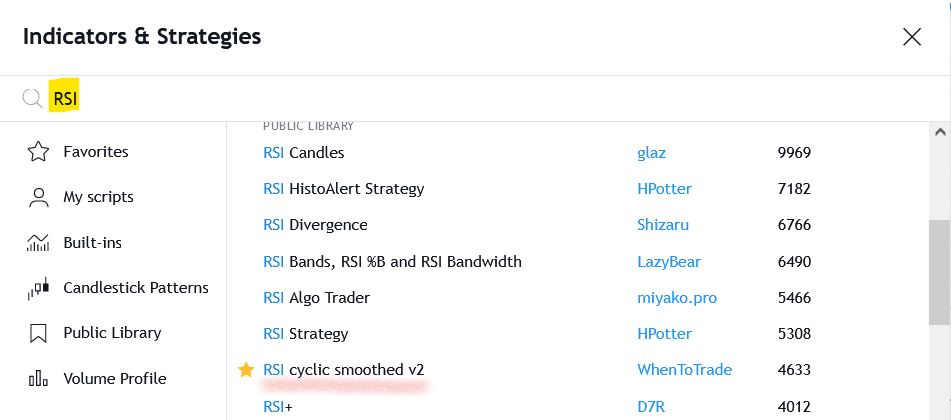
Our TradingView indicator version is available as public Open-Source indicator in their public library. If you want to use this indicator on your chart, use the "Indicators" button from the TradingView chart panel.
Search for "RSI" in the "Indicators" window and select the "RSI cyclic smoothed v2" from WhenToTrade as indicator.
Source Code
You can also open the source code and adjust for your own needs. The script page with code is available via this link at TradingView: https://www.tradingview.com/script/TmqiR1jp-RSI-cyclic-smoothed-v2/
This indicator is not designed for use as an automated trading strategy
This is an improved technical indicator using the dominant cycle to provide its advanced features. It can be used as drop-in replacement for the classic RSI. The basic applications of technical analysis for oscillators and the Relative Strength Index apply. The script is intended for use in discretionary trading.
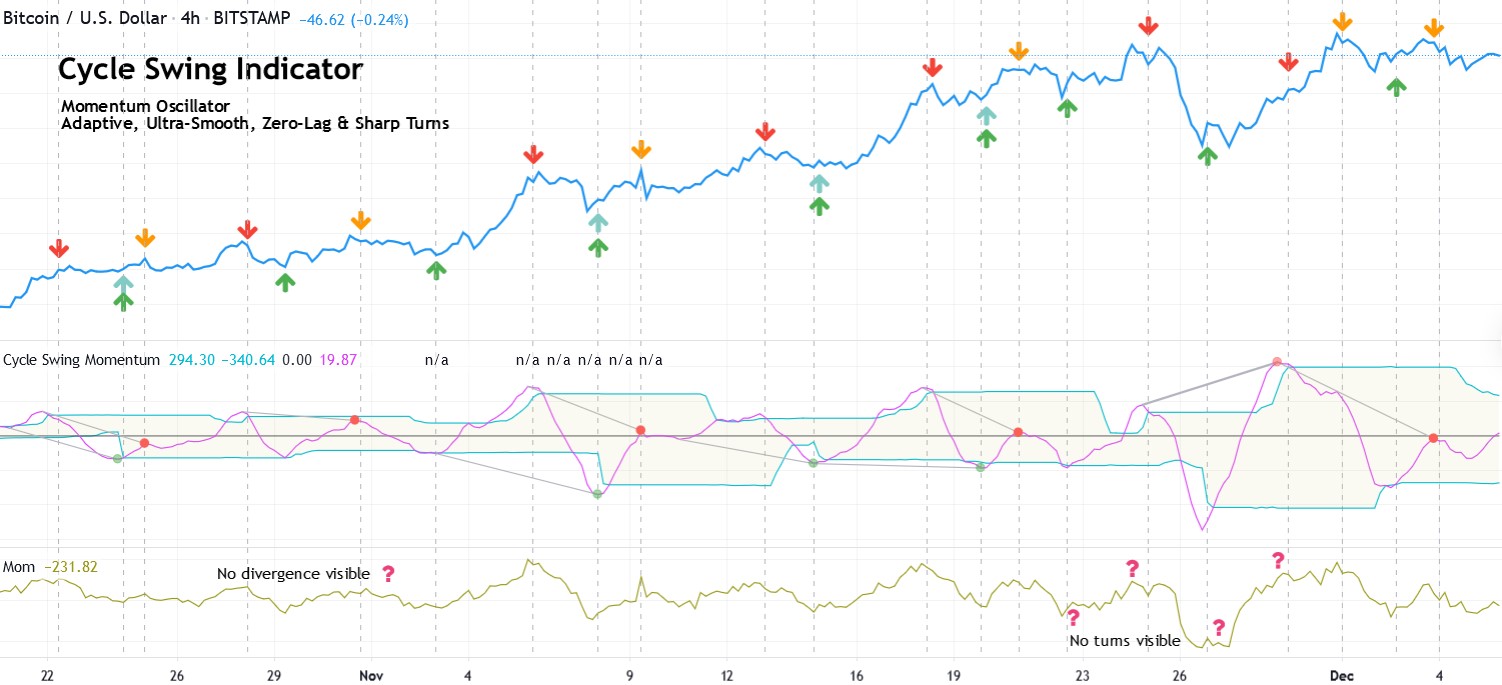
Cycle Swing Indicator
The Cycle Swing Indicator indicator is an enhancement of the classic Momentum indicator. The cyclic-tuned momentum indicator was first introduced in the book "Decoding the Hidden Market Rhythm Part 1: Dynamic Cycles" (LINK) and the indicator code has been made public for different charting platforms. It does not require any input or parameter as this indicator automatically adjusts the calculation according to the main market cycle.
Key Features
Popular technical indicators often react too slowly to changes and deliver shaky signal lines. If they are smoothed, the lag becomes greater and greater, rendering the signals useless for real-time analysis.
When the lag is eliminated and the smoothed, clear reversal points are restored, new options for technical analysis arise. The Cycle-Swing Indicator is fast, clear and smooth. You get better timing, greater accuracy, and better signals.
Many systems include momentum as an indicator. Until now, however, momentum signals have been extremely jittery, resulting in whipsaw trades. In contrast, the adaptive cycle swing generates an ultra-smooth swing without adding lag to the original signal.
The Cycle Swing Indicator "CSI" provides an optimized "momentum" oscillator based on the current dominant cycle by considering the dominant cycle swing instead of the raw source momentum. Offering the following improvements:
- Smoothness
- Zero delay
- Sharpness at turning points
- Robust and adaptable to market conditions
- Accurate deviation detection
The following common problems with standard indicators are solved by this indicator:
First, normal indicators introduce a lot of false signals due to their noisy signal line. Second, to compensate for the noise, one would normally try to add some smoothing. But this only results in adding more delay to the indicator, which makes it almost useless. Third, standard indicators require a length adjustment to derive reliable signals. However, you never know how to set the right length.
All three problems described above are solved by the developed adaptive cyclic algorithm.
Add to chart
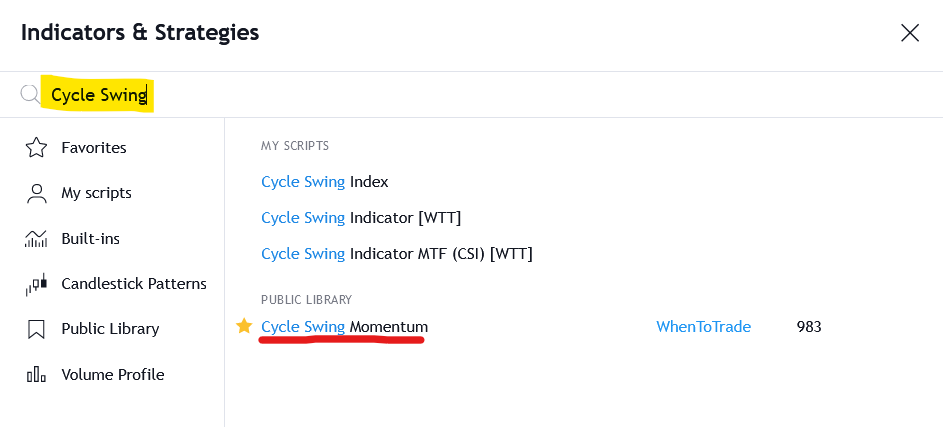
Our TradingView indicator version is available as public Open-Source indicator in their public library. If you want to use this indicator on your chart, use the "Indicators" button from the TradingView chart panel.
Search for "Cycle Swing" in the "Indicators" window and select the "Cycle Swing Momentum" from WhenToTrade as indicator.
Source Code
You can also open the source code and adjust for your own needs. The script page with code is available via this link at TradingView: https://www.tradingview.com/script/b7o7GmWT-Cycle-Swing-Momentum/
This indicator is not designed for use as an automated trading strategy
This is an parameter-less improved technical indicator. It can be used as drop-in replacement for the classic momentum. The basic applications of technical analysis for oscillators and the Momentum oscillator apply. The script is intended for use in discretionary trading.