Cycle Tools - App Manual
User Manual on how to use the Cycle Tools Application provided at https://cycle.tools
- Data Management
- Cycle Scanner
- Integrations
- Cycle Analysis API
- Python Integration
- Excel Workbooks
- NinjaTrader Integration
- Live Pulse Streams
- MotiveWave Integration
- TradingView Integration
- Market Pulse
- Cycles App FAQ
- Live Webinars and Private Collaboration Room
- Change Log
- AI Reports
Data Management
How to manage data in the cycles app for analysis
Integrated Datafeeds
The cycle toolbox has integrated external data-sources for end-of-day datasets. It includes major global stocks, market indices, crypto-currencies and forex data.
Stock market data
The market type ID to get major global stocks and indices datasets is YFI. Use Yahoo Finance for symbol search.
For weekly data add -W to the symbol.
Example symbols are:
Crypto-currency datasets
The market type ID to get crypto datasets is CDS.
Generic symbol format is: [FromSymbol]-[ToSymbol]-[Exchange]
Short usage is: [Symbol] – in this case ToSymbol is USD and the exchange is CCCAGG index *.
Example symbols are:
Managed Forex datasets
The market type ID to get managed forex currency pairs is FX.
Generic symbol format is: [FromSymbol][ToSymbol]
Economic datasets (FRED)
Access to the economic data services of the Economic Research Division of the Federal Reserve Bank of St. Louis. The market type ID to get FRED data is FDS.
Online symbol search via FRED: https://fred.stlouisfed.org/
Example symbols are:
| Symbol | Name | Cycle Tools Symbol ID | Link |
| VIXCLS | CBOE Volatility Index | VIXCLS:FDS | Open |
| VXDCLS | DJIA Volatility Index | VXDCLS:FDS | Open |
| T5YIFR | 5-Year Forward Inflation Expectation Rate | T5YIFR:FDS | Open |
| STLFSI2-W | St. Louis Fed Financial Stress Index (Weekly) More dataset details |
STLFSI2-W:FDS | Open |
Quandl datasets
The market type ID to get free quandl datasets is QDS.
Generic symbol format to load free quandl data via the time series API:
[Quandl database code]-[Quandl dataset code]-[column]-[collapse]
[column] (optional)
Ensure that you pick that correct column number. The column number is different for each dataset.
[collapse] (optional):
| none daily weekly monthly quarterly annual |
Change the sampling frequency of the returned data. Default is none; i.e., data is returned in its original granularity. |
Example symbols are:
| Database-Symbol | Name | Cycle Tools Symbol ID | Link |
| CHRIS-EUREX_FDAX1-4 | DAX Futures, Continuous Contract #1 (FDAX1) (Front Month), EUREX, Settle | CHRIS-EUREX_FDAX1-4:QDS | Open |
| FSE-VOW3_X | Volkswagen AG, Stock Price, Frankfurt Stock Exchange | FSE-VOW3_X:QDS | Open |
| BSE-Sensex | Bombay Stock Exchange – SENSEX Index | BSE-Sensex:QDS | Open |
| LBMA-Gold-2 | Gold London Fixing USD PM (London Bullion Market Association) More dataset details |
LBMA-Gold-2:QDS | Open |
| LBMA-Gold-2-weekly | Gold London Fixing USD PM weekly data | LBMA-Gold-2-weekly:QDS | Open |
| LBMA-Gold-4 | Gold London Fixing GBP PM (London Bullion Market Association) More dataset details |
LBMA-Gold-4:QDS | Open |
| LBMA-Silver-3 | Silver London Fixing EUR (London Bullion Market Association) More dataset details |
LBMA-Silver-3:QDS | Open |
| ECB-EURJPY-1 | EUR vs JPY Exchange Rate (European Central Bank) More dataset details |
ECB-EURJPY:QDS | Open |
| CHRIS-ICE_CC5-4 | Cocoa Futures, Continuous Contract (Settle) More dataset details |
CHRIS-ICE_CC5-4:QDS | Open |
| CHRIS-ICE_B1-4 | Brent Crude Futures, Continuous Contract (Settle) More dataset details |
CHRIS-ICE_B1-4:QDS | Open |
| CHRIS-ICE_B1-4-weekly | Brent Crude Futures, Continuous Contract (Settle) - weekly | CHRIS-ICE_B1-4-weekly:QDS | Open |
*) Data is sourced from CryptoCompare. If no exchange is specified the CCCAGG index data will be returned. The Crypto Coin Comparison Aggregated Index (“CCCAGG”) refers to the real-time index calculation methodology, the purpose of which is to show the best price estimation for crypto traders and investors to value their portfolio at any time. It aggregates transaction data of over 70 exchanges,using 24 hour volume weighted average. The CCCAGG is calculated for each crypto coin in eachcurrency it is trading in. We provide the data from CryptoCompare to the community based on their license without any additional change or charge (for research, software/applicationdevelopment, portfolio valuation, etc.), and is under the Creative Commons Attribution-NonCommercial3.0 Unported (CC BY-NC 3.0) license ( https://creativecommons.org/licenses/by-nc/3.0/ ).
Upload your own data
You can upload your own datasets as CSV files and save them in the cycles app. A CSV ("comma-separated values") file is a delimited text file that uses a comma to separate values.
You can always manage (add, remove, update) your own saved data-sets in the settings area:
https://cycle.tools/settings/datasets
To upload new data series, go to the Settings -> MyDatasets area and click "Upload New".
You need to ensure the right format of your text file. The first line always needs to include the header "time, value" indicating each following line has a text for the date/time and a numeric value (e.g. close).
EOD
 time, value
 2019-04-11, 80.01
 2019-04-12, 82.1
Use the attached file eod_upload_test.csv shown in the navigation panel as template with daily data.
Intraday
time, value
2019-04-11 13:01, 2301
2019-04-12 13:02, 2320
Please see and test the attached file (eurusd-1h-example.csv) shown in the navigation panel as template with 1h intraday data for the EURUSD.
Generic date formats
yyyymmdd
Cycle Scanner
How to use the Cycle Scanner or Cycle Finder
Settings Panel
The following video is an How-To walk through on the configuration parameters of the settings panel in the Cycle Scanner window.
This video is based on our webinar series and has special focus on:
* Cycle Skew
* Power Spectrum
* Profile 1 / Profile 2 (P1, P2)
Asymmetric Business Cycles and Cycle Skewness
Preface:
Cycle analysis and cycle forecasting often imply the use of a symmetric time distribution between high to low and low to high. This is the underlying framework used by anyone applying mathematical signal processing to cycles and producing cycle-based composite cycle forecasts. This technique is now faced with a new challenge that has emerged over the past 30 years based on financial regulations impacting today’s economic business cycle. The following article will highlight the situation and present the reader with a proposed skew factor to account for this behavior in cycle forecasting models.
Business cycles are a fundamental concept in macroeconomics. The economy has been characterized by an increasingly negative cyclical asymmetry over the last three decades. Studies show that recessions have become relatively more severe, while recoveries have become smoother, as recently highlighted by Fatas and Mihov. Finally, recessive episodes have become less frequent, suggesting longer expansions.
As a result, booms are increasingly smoother and longer-lasting than recessions.
These characteristics have led to an increasingly negative distortion of the business cycle in recent decades. Extensive literature has examined in detail the statistical properties of this empirical regularity and confirmed that the extent of contractions tends to be sharper and faster than that of expansions.
In a paper published in the American Economic Journal on Jan. 2020, Jensen et al. summarized:
Booms become progressively smoother and more prolonged than busts. Finally, in line with recent empirical evidence, financially driven expansions lead to deeper contractions, as compared with equally sized nonfinancial expansions.
When recessions become faster and more severe and recoveries softer and longer, standard symmetric cycle models are doomed to fail. This new pattern challenges the existing standard, symmetrical, 2-phase cycle models.
Since 2-phase cycle models are based on a time-symmetric distribution of dominant cycles with mathematical sine-based counting modes from low to low or high to high. However, these models lose their forecasting ability under the assumption that a uniform distribution from high to low and low to high is no longer given.
A new model is needed. A dynamic skew cycle model that includes a skew factor.
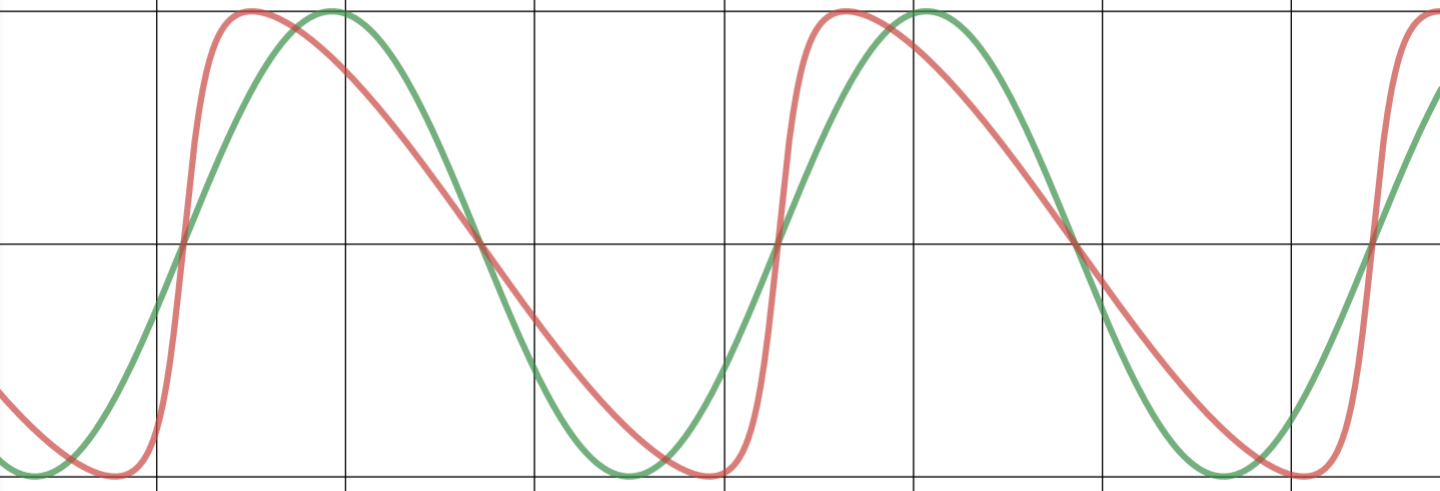
Before introducing a new mathematical model to account for the asymmetric behavior, the cycle difference will be visualized and compared with some diagrams. The following illustration shows a classical, symmetrical 2-phase cycle on the left (green) and an asymmetric 3-phase cycle is highlighted on the right (red).
Asymmetric Cycle Model
This following model shown in Chart 1 uses a simplified formula that allows different distortions of the phases with a skew factor, but also keeps the length of the whole cycle, from peak to peak, the same without distortion.
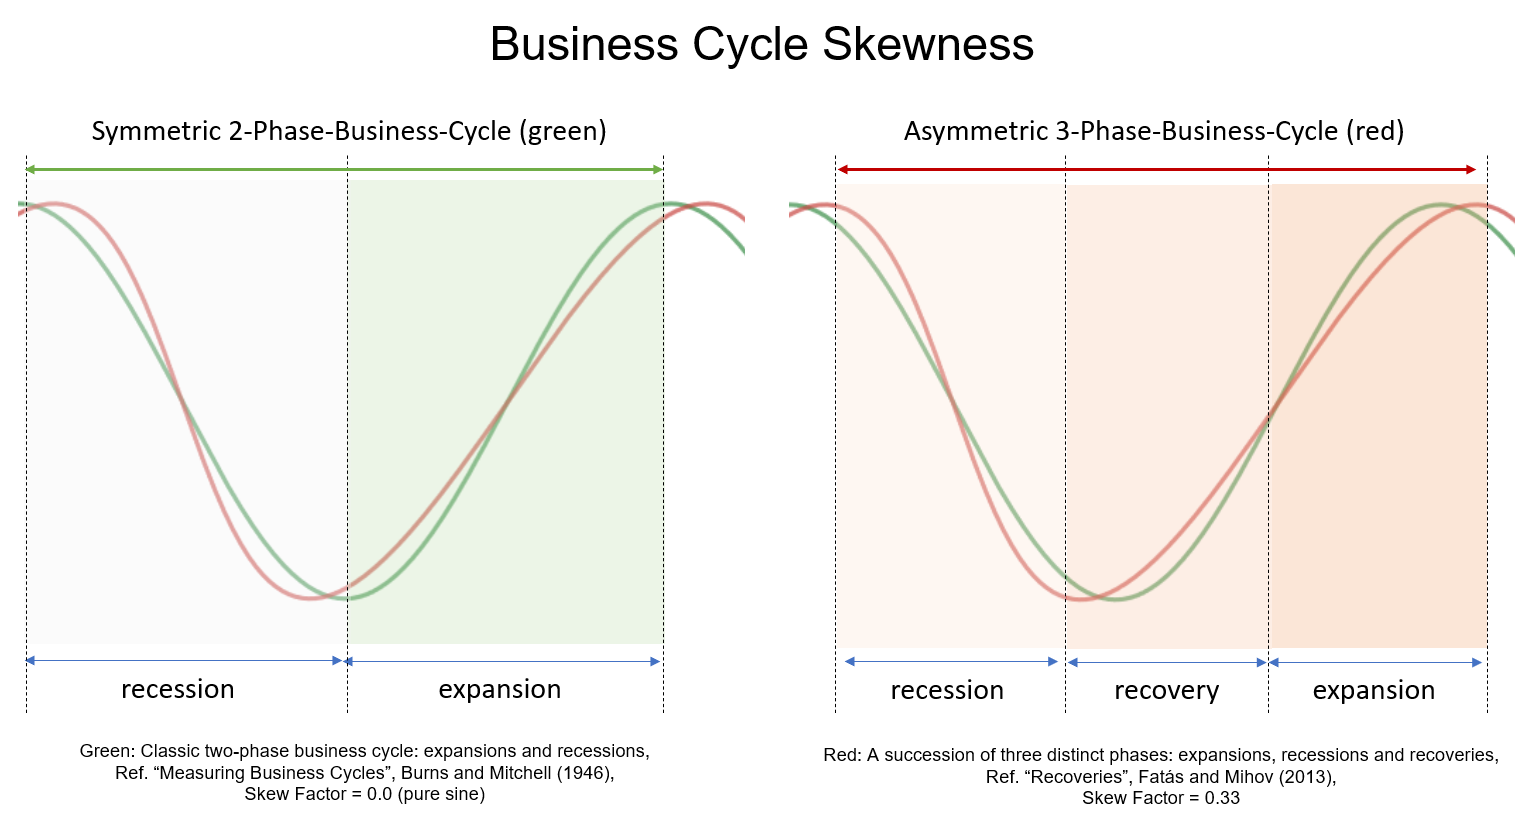
Chart 1: Comparing 2-phase symmetric (green) and 3-phase asymmetric cycle models (red)
The new “skew factor” used in the red model shows that the upswing phase is twice as long as the recession, while ensuring the same total duration and amplitude of the standard, 2-phase cycle model (green, left). This allows us to model identified cycle lengths and strengths in the 3-phase model (red, right).
So, if we add the “skew factor” to the traditional mathematical cycle algorithms, we get cycle models that consider the asymmetric changes mentioned above. And thus, the cycle models can be used again for forecasts.
Example: The skew factor on the S&P 500 index
The next chart 2 shows a detected dominant, symmetric cycle with a length of 175 bars in January 2020 for the S&P 500 index. The light blue price data were not known to the cycle detection algorithm and represent the forecast out-of-sample range. The cycle is shown as a pink overlay. This symmetrical cycle forecast predicts that the peak would occur as early as the end of 2019, and a new low for this cycle to occur in May.
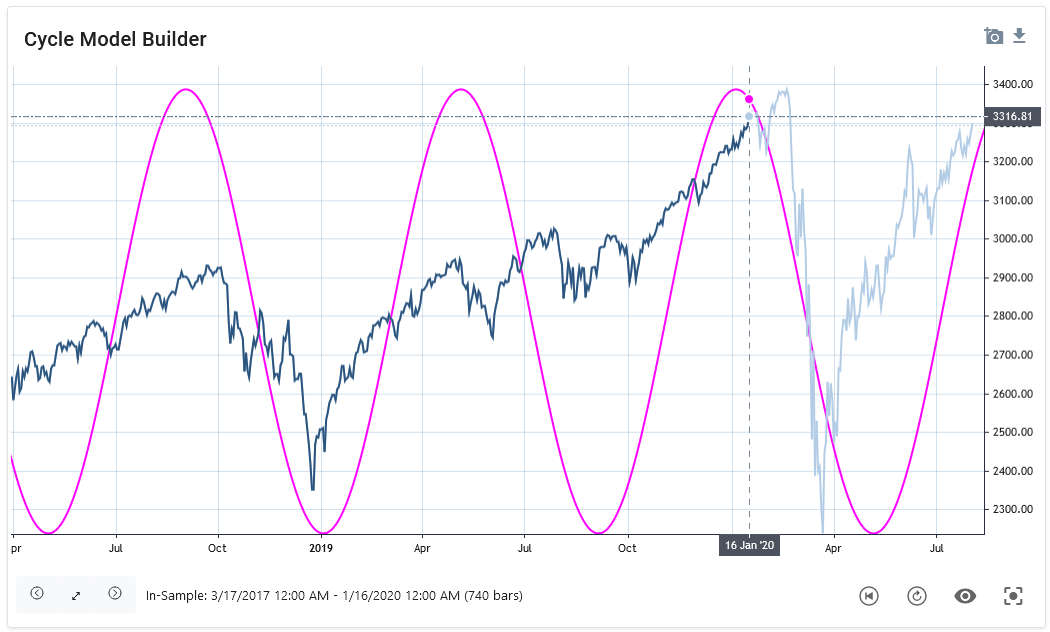
Chart 2: S&P 500 with 175 day symmetric cycle, skew factor: 0.0, date of analysis: 16. Jan 2020
As can be seen, the predicted high was too early than the real market top, and the predicted low was too late compared to the market low. This is a common observation when using symmetric cycle models in today’s markets. On the one hand, the analyst can now anticipate, based on knowledge of asymmetric variation, that the predicted high will be too early and the plotted low too late. However, additional knowledge of the analyst is required without being represented in the model. A better approach would be to include this knowledge already in the modeling of the cycle projection.
Therefore, we now add the skew factor to the detected cycle analysis approach.
In the next graph (Chart 3), a skew factor to the same 175-day cycle is applied. The date of analysis is still January 16, and the light blue is the prediction out-of-sample period. Here the asymmetric cycle forecast projects the peak for late January and the low for March 2020. The real price followed this asymmetric cycle projection more accurately.
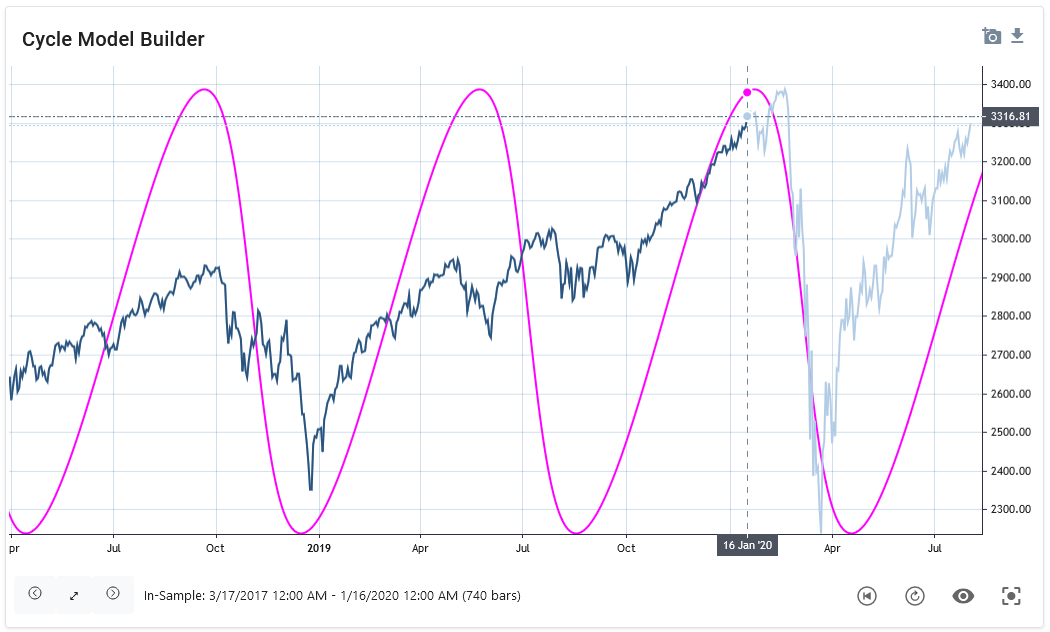
Chart 3: S&P 500 with 175 day asymmetric cycle, skew factor: 0.4, date of analysis: 16. Jan 2020
This example demonstrates the importance to adapt traditional cycle prediction models with the addition of a skew factor. The introduction of a skew factor is based on the current scientific knowledge of the changed, asymmetric business cycle behavior.
The next paragraph explains how this asymmetry can be applied to existing, mathematical cycle models by introducing the skew factor formula.
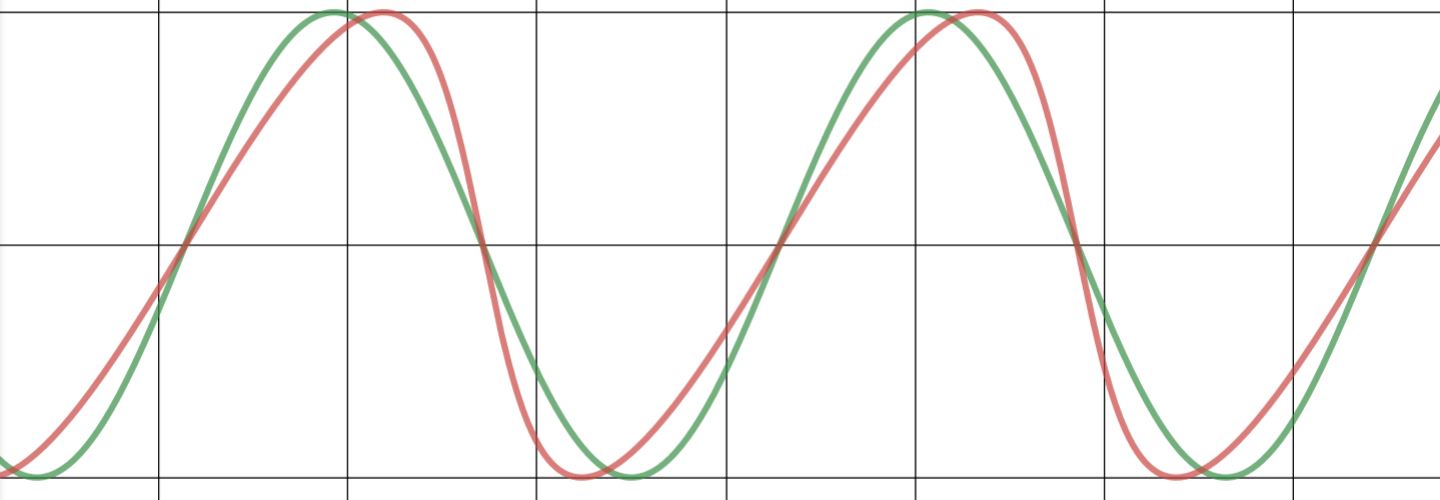
Cycle Skew
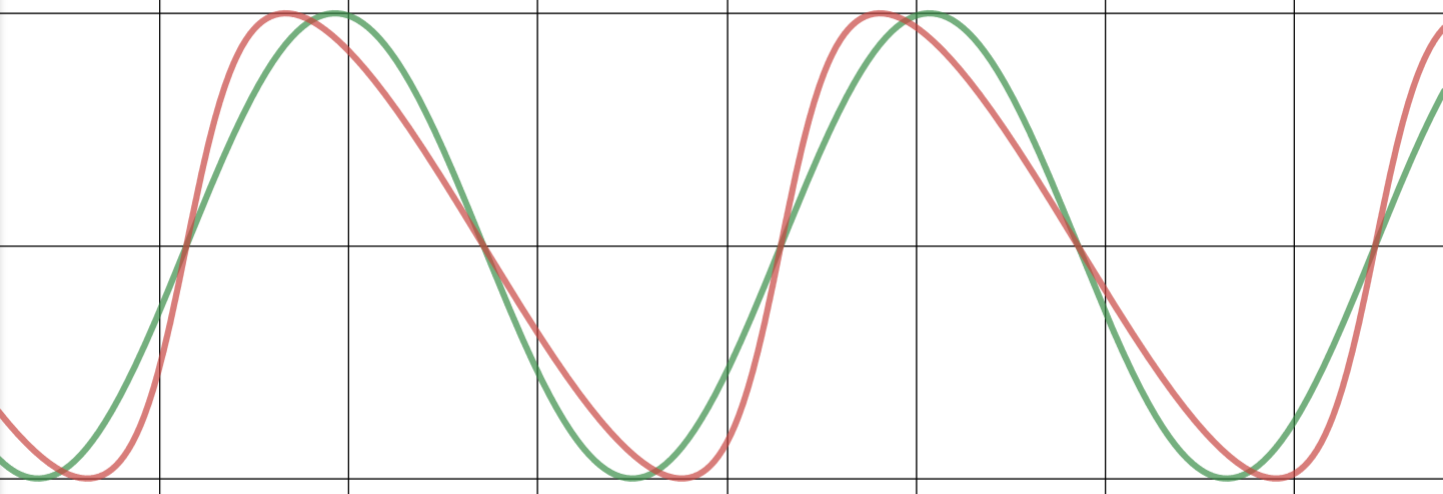
The skew factor allows the representation of an asymmetric shape for business cycles in a cyclic model, as shown in the following examples. The green cycle is a standard sine-wave cycle (skew=0.0); the red cycle applies a specific skew factor.
Examples
|
|
 |
|
skew = 0.5 |
skew = 0.75 |
|
|
 |
|
skew = -0.5 |
skew = -0.75 |
(a+cosx)cosn+bsinxsinn(a+cosx)2+(bsinx)2
Desmos interactive playbook: https://www.desmos.com/calculator/ejq06faf93
Math & Code
Equation
To apply the cycle skew, the skewed sine wave equation is introduced instead of a pure sine wave, sin(x), formula:

Where:
skew = skew factor [Range: -1 ... +1]
x = phase (rad)
Math LaTeX code
SineSkewed({\color{DarkGreen} x}, {\color{Blue} s_{kew}})=\frac{\sin {\color{DarkGreen} x}}{\sqrt{({\color{Blue} s_{kew}}+\cos {\color{DarkGreen} x})^2+(\sin {\color{DarkGreen} x})^2}}
.NET C# code
Skewed sine wave function
double MathSineSkewed(double x, double skew)
{
  double skewedCycle = Math.Sin(x) /
                       Math.Sqrt(Math.Pow((skew + Math.Cos(x)), 2) + Math.Pow((Math.Sin(x)), 2));

  return skewedCycle;
}
How to use in a cycle forecast algorithm
A common approach is to build cycle prediction models based on detected or predefined values for cycle length, phase, and amplitude. These models use a standard sine wave function to create a cycle forecast or composite forecast projection. To retain these models and not recreate an existing model, the proposal presented in this paper is to simply replace the existing standard sine wave function with the new skewed sine wave function. Thus, any cycle prediction algorithm can remain as is and use the detected cycles with length, amplitude, and phase as input parameters. At the same time, the projection function is replaced with the new skewed sine function instead of the standard sine function.
The main features of this function in brief:
- It is designed as a drop-in replacement for existing sine or cosine functions used for cycle prediction. It is not necessary to adjust the existing overall model. Simply use this function as a drop-in replacement in an existing algorithm.
- A skew factor of 0.3-0.4 should be used to fit the model according to current scientific evidence on the asymmetry of the business cycle.
- The cycle will not be skewed. The length is preserved. Thus, the top-to-bottom and bottom-to-top cycle counts are preserved and are not distorted. The amplitude will not be distorted either. In this way, it is a safe replacement, with the main cycle parameters of length and amplitude remaining intact.
Summary
The current scientific literature shows the increasingly asymmetric behavior of economic cycles. Explanations can be found in the changing behavior of the financial systems in the US and G7 countries. Against this background, previous 2-phase symmetric cycle models need to be adjusted. The demonstrated approach of introducing an additional skew factor into existing sinusoidal models can help to better adapt cycle-based forecasts to this situation.
Further Reading
- Salgado et al. (2020): Skewed Business Cycles
- Morley, Piger (2012): The Asymmetric Business Cycle
- Jensen et al., (2020): Leverage and Deepening Business Cycle Skewness
- Fatas, Mihov (2013): Recoveries
As published in "Cycles Magazine":

This article was published in the CYCLES MAGAZINE, Jan. 2021. The Official Journal of the Foundation for the Study of Cycles. Vol. 48 No2 2021. Page 80ff. (Source Link: https://journal.cycles.org/Issues/Vol48-No2-2021/index.html?page=80 )
(a+cosx)cosn+bsinxsinn(a+cosx)2+(bsinx)2
Integrations
How integrate the cycle analysis API with 3rd party applications and charting platforms
(Info: Integration package is not available in FSC membership. Requires WTT account.)
Cycle Analysis API
API Documentation
You can visit and browse our interactive API docs via ReDoc (read only): api.cycle.tools/apidocs
Or test the interactive API console with your API key in the swagger console: api.cycle.tools/specs
To generate your API key, go to: https://cycle.tools/account/api
Requires an whentotrade "Analyst" subscription level. API endpoints are not available in the "Basic" or "FSC membership" version.
API Limits
API requests limits for the Analyst package are:
| Request Period | Limit |
| 1 second | 50 |
| 1 minute | 200 |
| 1 hour | 1000 |
| 1 day | 5000 |
| 30 days / 1 month | 20000 |
If you need more requests, please contact us via eMail.
Python Integration
Ensure you use your personal API key. You can set your API key in the cycle.tools console.
Replace YOUR_API_KEY in the examples with your personal key.
CycleExplorer Endpoint
Use this endpoint to post raw data series array to the endpoint. The example will pull eod data from yahoo api first and send to the cycle analsis api to get current dominant cycle:
import requests
import json
import yfinance as yf

#put your cycle.tools API key
cycleAPIkey = 'YOUR_API_KEY'

#set cycle.tools API url endpoint
url = f"https://api.cycle.tools/api/cycles/CycleExplorer?dynamicInSampleMethod=true&api_key={cycleAPIkey}";

# set the yahoo ticker symbol, eg SP500=^GSPC
tickerSymbol = "^GSPC";

#get data on this ticker
tickerData = yf.Ticker(tickerSymbol)

#get the historical prices for this ticker
tickerDf = tickerData.history(interval="1d", period="5y")

#get close data as json doubele array
jsondata = tickerDf['Close'].to_json(orient='records')

#call CycleExplorer endpoint to get current dominant cycle
r= requests.post(url, data=jsondata,
         headers={'Content-Type':'application/json'})

#get the dominant cycle return data
dominantCycle = r.json()
dominantCycleLength = dominantCycle['length']

#print the current dominant cycle length
print(f"Dominant Cycle Length: {dominantCycleLength}")

#print the json the results
print()
print(json.dumps(r.json(), indent=4, sort_keys=True))
Example output:
Dominant Cycle Length: 165.0
JSON response:
{
 "amplitude": 146.00174004966559,
 "analysisEndDate": "2020-05-03T17:02:20.6771012+00:00",
 "analysisStartDate": "0001-01-01T00:00:00",
 "barsAvailable": 0,
 "barsused": 750,
 "currentPrice": 2830.71,
 "cycleProfitability": 0.75,
 "lastlow": -5.6668009766674174,
 "lasttop": -88.16680097666742,
 "length": 165.0,
 "license": "api.cycle.tools :You agree to the API usage terms and conditions from host ",
 "minbaroffset": 170.66680097666742,
 "nextlow": 159.33319902333258,
 "nexttop": 76.83319902333258,
 "phase": -1.3169251392646713,
 "phase_score": -100,
 "phase_status": "BOTTOM_Departure",
 "phasingScore": 135,
 "statusCode": null,
 "symbol": "manual",
 "timeSeries": []
}
MarketCycles Endpoint
Use this endpoint for known symbols IDs. The example will use the integrated crypto datafeed to get the current dominant cycle in Bitcoin:
import requests
import json

#put your cycle.tools API key
cycleAPIkey = 'YOUR_API_KEY'
symbol="BTC" # Bitcoin
market="CDS" # Crypto

#set cycle.tools API url endpoint
url = f"https://api.cycle.tools/api/cycles/MarketCycles/{symbol}?marketType={market}&api_key={cycleAPIkey}"

#call MarketCycles endpoint to get current dominant cycle
r= requests.get(url)

#get the dominant cycle return data
marketCycle = r.json()
marketCycleLength = marketCycle['length']

#print the current dominant cycle length
print(f"Dominant Cycle Length: {marketCycleLength}")

#print the json the results
print()
print(json.dumps(r.json(), indent=4, sort_keys=True))
Example output:
Dominant Cycle Length: 39.0
JSON response:
{
    "amplitude": 418.6291962393411,
    "analysisEndDate": "2020-05-01T00:00:00",
    "analysisStartDate": "2016-11-28T00:00:00Z",
    "barsAvailable": 750,
    "barsused": 750,
    "currentPrice": 8728.58,
    "cycleProfitability": 0.7105263157894737,
    "lastlow": -7.758826601781372,
    "lasttop": -27.258826601781372,
    "length": 39.0,
    "license": "****** : You agree to the API usage terms and conditions from api.cycle.tools",
    "minbaroffset": 46.75882660178137,
    "nextlow": 31.241173398218628,
    "nexttop": 11.741173398218628,
    "phase": -0.15968528545011673,
    "phase_score": 40,
    "phase_status": "Uptrend_Neutral",
    "phasingScore": 0,
    "statusCode": "OK",
    "symbol": "BTC",
    "timeSeries": []
}Excel Workbooks
How to use cycle analysis with Microsoft Excel via the Cycle Tools API
Dominant Market Cycles
The MarketCycles API endpoint allows you to do dominant cycle analysis for stocks, index data, forex and commodities without the need to subscribe for data-feeds and complex tooling integration. The endpoint gives you all dominant cycle information, including full time-series charting data with a single call.
To get you started quickly, we provide here a short Excel sheet which allows to pull up dominant cycle information and to plot the chart with cycle as indicator. Exactly as you do it with charting software. However, here without the need for any charting tool or any datafeed subscription.
We just use the PowerQuery functions available in Excel to connect to external data-sources. There are two sheets prepared:
The first sheet allows you to specify the symbol/market to analysis and to change the parameters for the request. The update button refreshes the data and the table below shows the detected dominant cycle data.

On the right hand side of the Excel window, you can see two prepared queries using our GET MarketCycles API endpoint. If you are interested in the settings and query parameter, you can do a right-click on the query and select “Edit”. The “Advanced Editor” button shows you the detailed power query. You can see how the table “Parameter” is used to get the parameter to web source URL call.

The second sheet is a prepared chart view for the retrieved time-series with the price, dominant cycle and price-cycle-highligther:

This example demonstrated the power of decoupling our back-end from the front-end. This way, we can provide cycle analysis via our API and you decide which front-end software to use to analyze cycles. You can use the attached Excel sheet as starting point to expand your own analysis dashboards!
You can download the attached Excel Workbook WTT_MarketCycles to play with this example on your own. The API key is just for demo purposes and limited to allow free test. Please get your personal API key if you want to work with this endpoint.
Analyze Your own Data
The CycleScanner API endpoint allows you to post your individual dataset to our cycles engine and receive the analyzed cycles. The prepared Excel workbooks includes a running example with a sample dataset in sheet "dataset". You can change and put your data series in from any source. Once your copied your data, the "CycleScanner" sheet allows you to post the data directly from Excel to our API and receive the results in the lower section of the window:
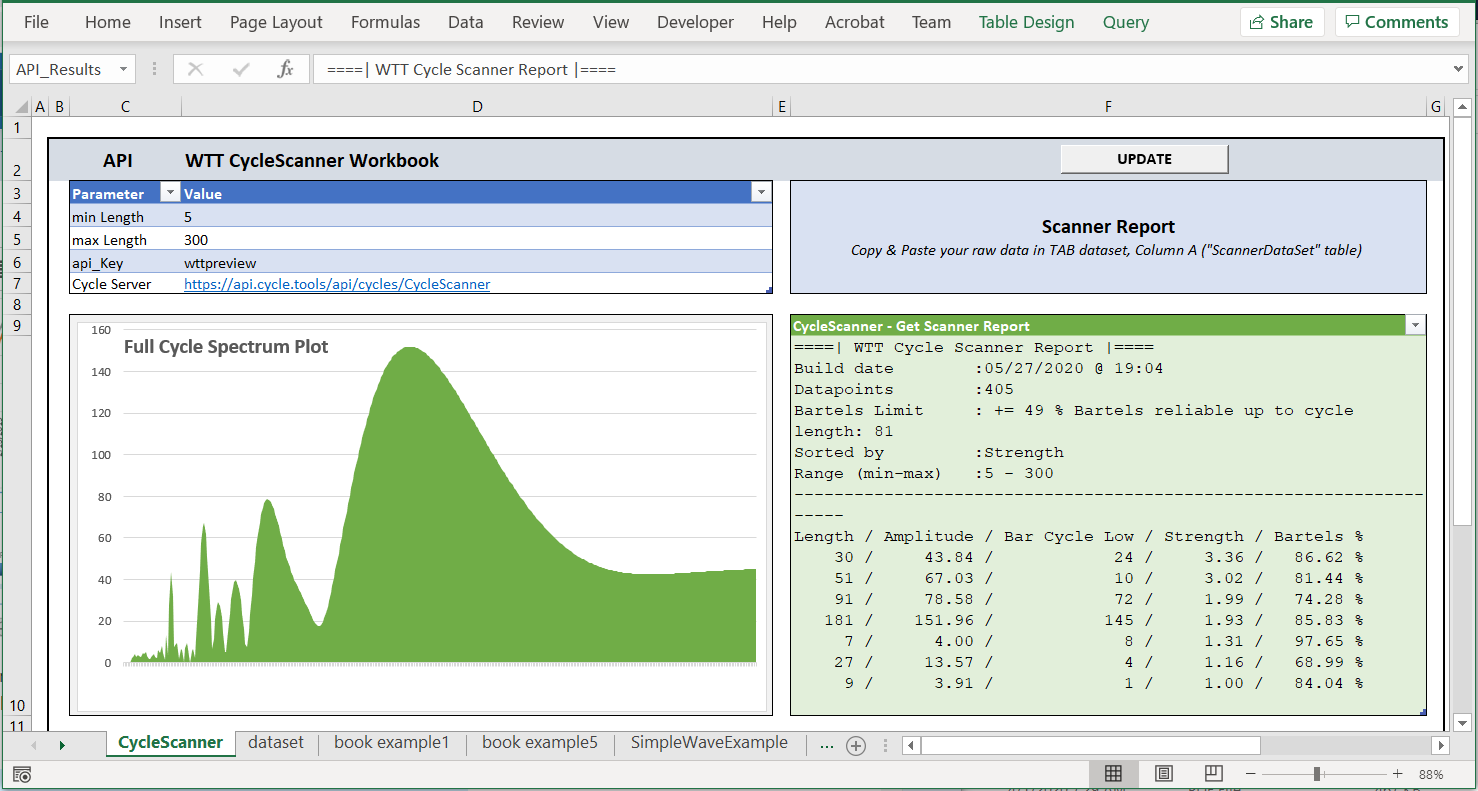
The left panel visualizes the returned results in a simple spectrum graph. The right panel shows the detected cycles in the dataset as a sorted table.
This playbook allows a quick start to get a full spectrum analysis for any data-series with a simple Excel workbook. The playbook is pre-filled with our example no. 5 from our book "Decoding The Hidden Market Rhythm - Part 1".
Please download the attached Excel workbook "WTT_CycleScanner_Workbook". Keep in mind the embedded API key is just for demo and test purposes.
Authorization to access web content from the Excel workbook
If you run the "update" function for the first time, you need to allow Excel to access the API endpoint via a call to "https://api.cycle.tools". You might see a screen like this:
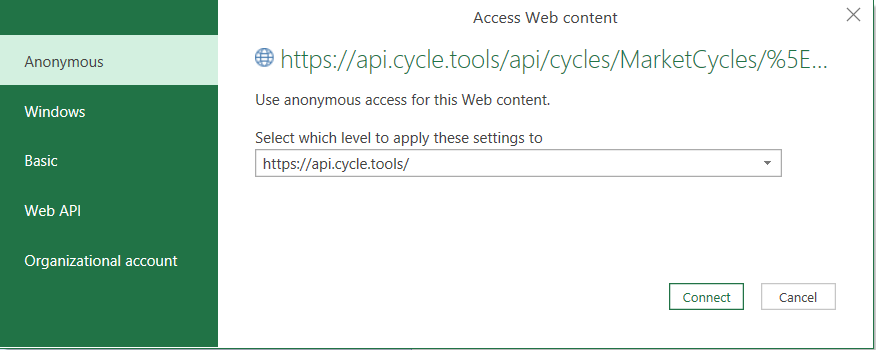
Select "Anonymous" and click connect. This allows the workbook to get data from our API.
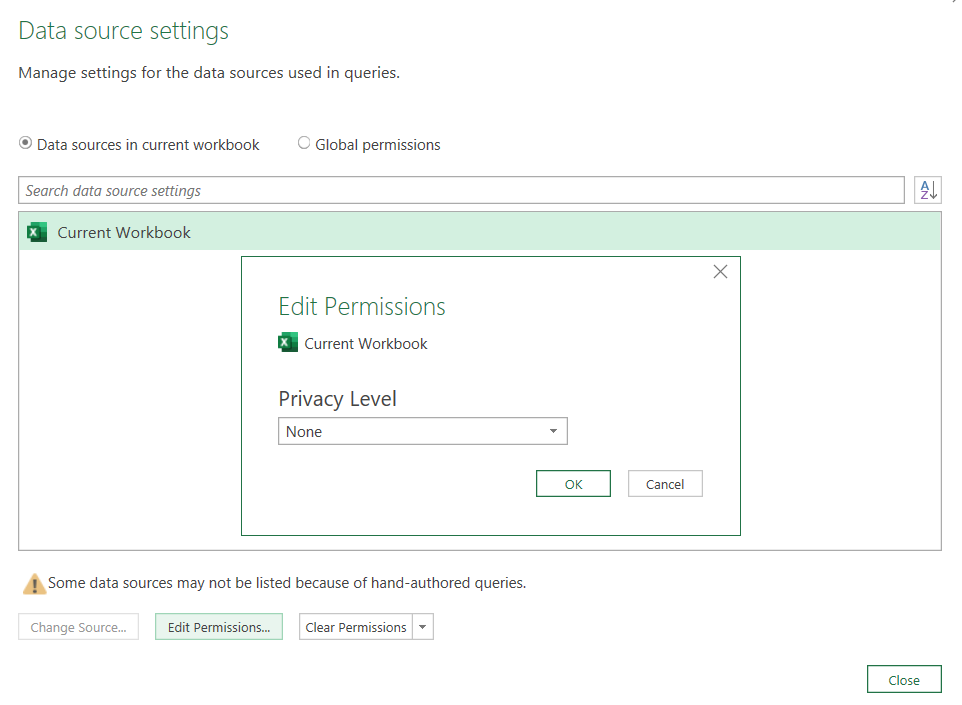
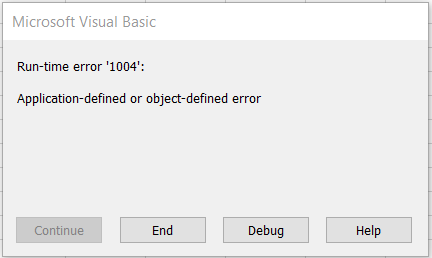
If you don't see this dialog and run into error screen ("1004") or the message "Load to worksheet failed", this might be related to missing authorization settings. In this case Excel is not allowed to access external data from your computer. You can try to resolve it to change the Data Source connection settings manually:
Go to Data -> Queries & Connections -> Double click on the query on the right section of the screen -> Data Source settings:
Another reason for receiving errors is that your API key or the test API key has reached the limit. In this case, the API will return an internal 429 error "Too Many Requests" and the query will fail. In this case, you might see a message box like this:
Ensure you have the correct and working API key. It indicates you are not authorized to access the API, either because your reached the API key limits or your Excel is not authorized to access web content.
NinjaTrader Integration
The following video shows how to integrate the cycle tools API within NinjaTrader to use cycle analysis for indicators in NT 8:
Download the NinjaTrader integration script as indicator via the attached zip file to this article.
Requires Cycles API key. An "Analyst" subscription level or higher is required. API endpoints are not available in the "Basic" or "FSC membership" version.
Live Pulse Streams
Preview v2 up and running again!
The service has been revised and has been reactivated as v2 after improving internal event handling. Features can be used, but might still be subject to change.
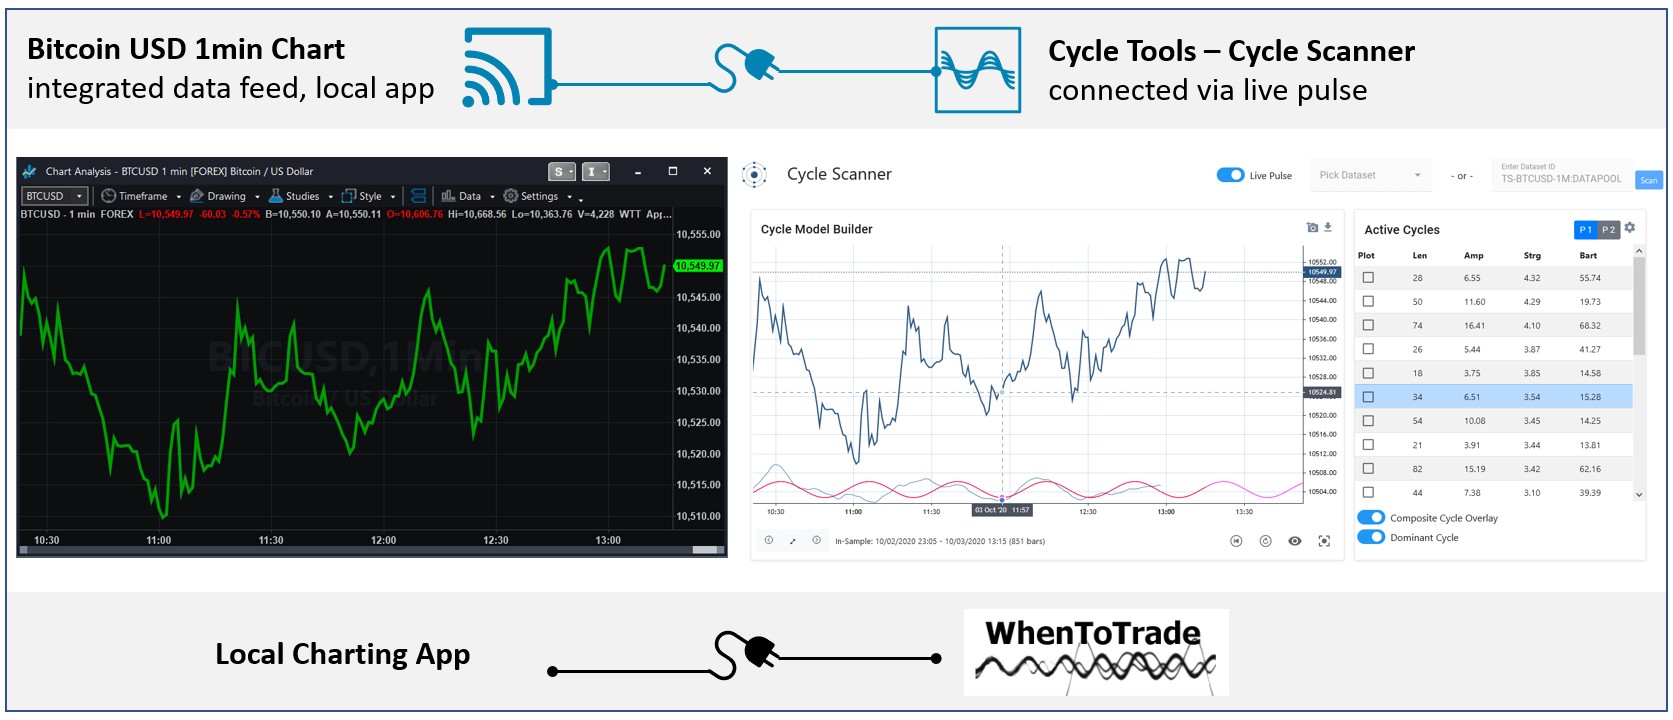
The Live Pulse Streams feature allows you to connect each of your preferred applications (e.g. NinjaTrade, TradeStation, ...) with integrated data feeds to the cycle analysis toolbox. Updating and synchronizing data from a local or cloud-based third-party application with the cycle scanner analysis capabilities of our cycle toolbox is done in near real-time. As a result, you can perform near real-time cycle analysis of private data for any data set, time frame, and application.
How does it work?
You start your application as usual and set up your favorite chart, symbol and interval. Next, you run a prepared script and insert it into your application. This script will be executed after new data or a new bar is received. Immediately after receiving, this script will send a new bar to the cycle toolbox for further cycle analysis. You may open a special cycle scanner web window in a browser to see how the dominant cycle is detected and plotted fully automatically.
As a result, you can run your favorite symbols and intervals with your existing data feed, via for example TradeStation or NinjaTrader, and connect live data directly to the cycle analysis toolbox. The Cycle Scanner monitors the arrival of new data and updates the analysis automatically.
The concept is illustrated by the following illustration:
What are the prerequisites?
- A valid cycle tools subscription with an existing API key is required. The API key must be provided when you activate your script in your custom application.
- It is required that you have your own third-party application with its own datafeed (e.g. TradeStation, NinjaTrader).
- Download and install the required scripts for your application.
- When not using the pre-built scripts, you can set up your script to use streams individually based on our Rest API documentation.
How to get started?
The following example shows screenshots from TradeStation. However, the scripts and approach is the same in other applications.
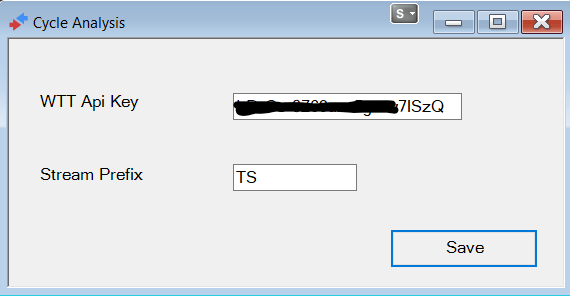
- Open your charting application. Provide the API Key and symbol prefix information in the settings window. As shown here, for Tradestation you enter the Api key into the Cycle Analysis TradingApp window. If you use the pre-build version for NinjaTrader, you will enter the Api Key in the indicator settings panel.
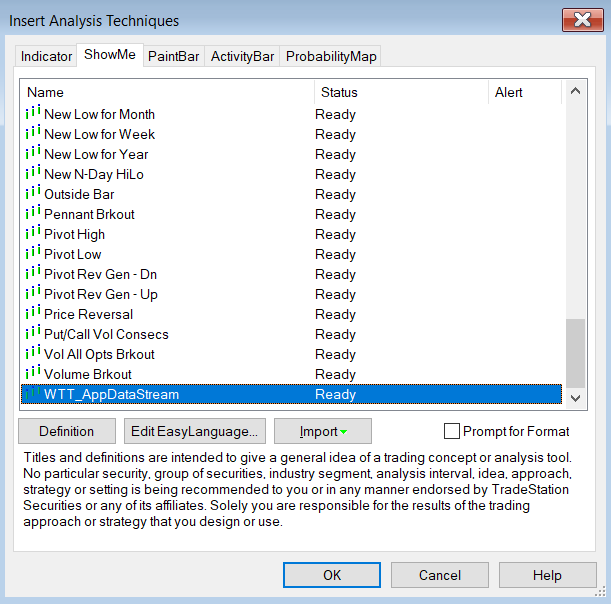
- On a running chart, apply a ShowMe (TradeStation) or Indicator (NinjaTrader) script named "WTT_AppDataStream" :

There are no settings for the script. This script will ensure to push and sync the data to the cycles toolbox. The script will use the following convention to create a cycles datafeed ticker id:
[PREFIX]-[SYMBOL]-[INTERVAL][PERIOD]:[USERNAME]
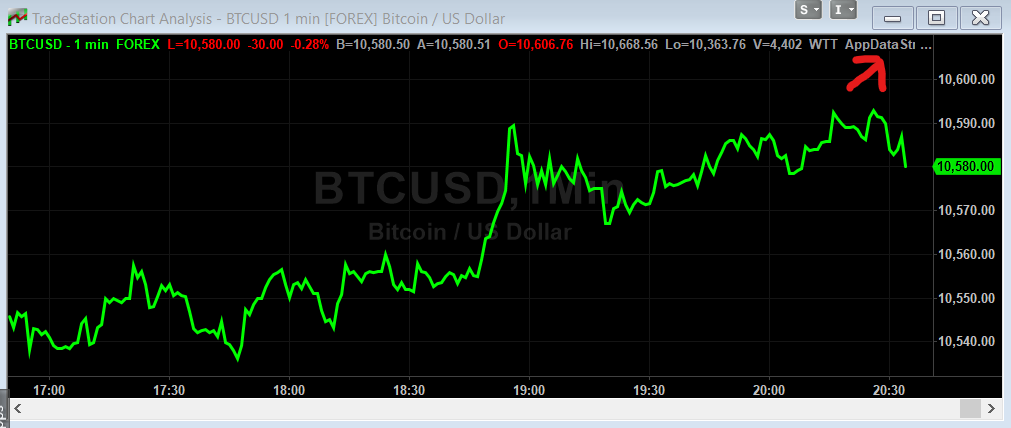
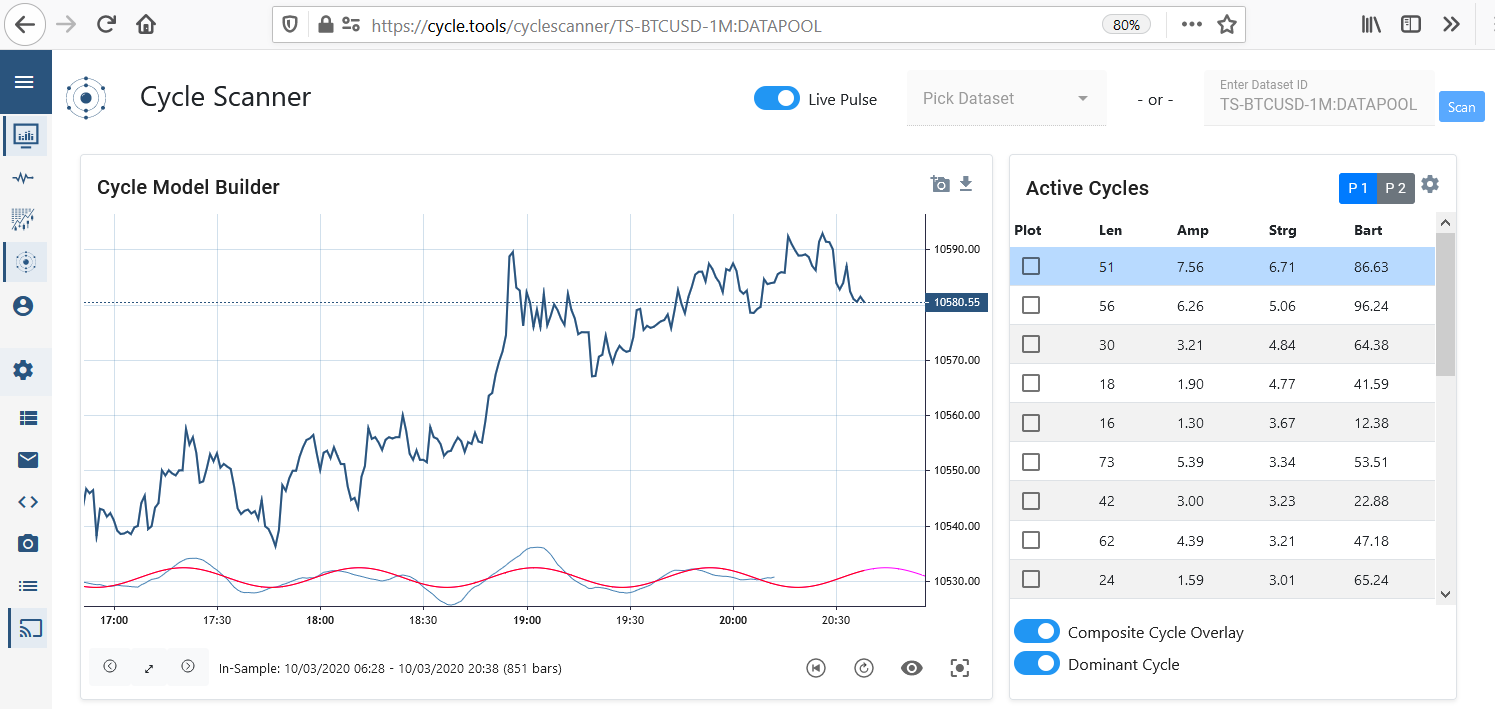
If you have a 1min BTC USD chart running, the live stream will be available on the cycle analysis platform with the tickerid: TS-BTCUSD-1M:[USERNAME]
If no errors or alerts show up, the chart is now connected as live stream to the cycles toolbox.
TradeStation Platform
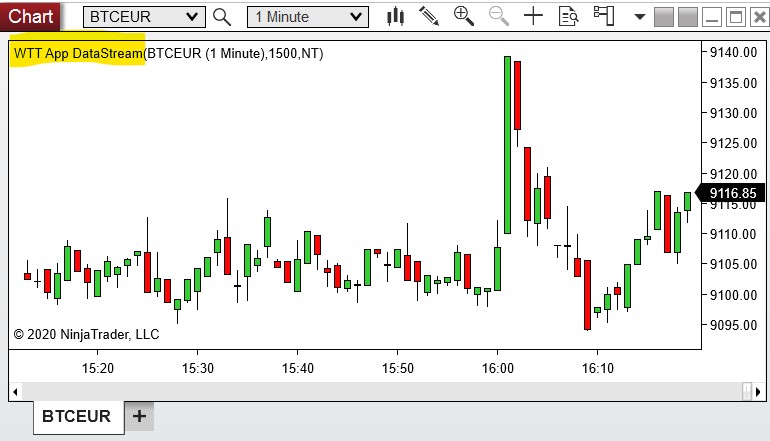
NinjaTrader Platform - Login to the cycles toolbox at cycle.tools and open the "My Streams" section within the "Settings" menu:
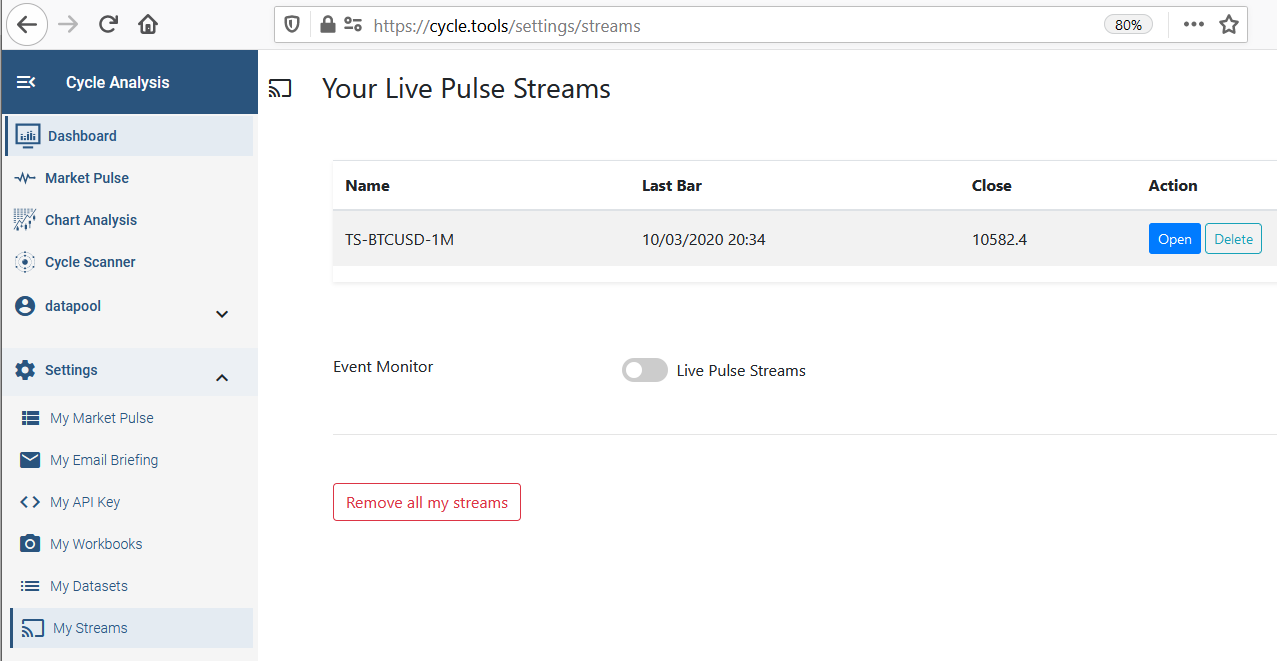
The connected datafeed should show up in the table with the Name Id. Streams connected via TradeStation should begin with the TS prefix. Streams connected via NinjaTrader start with a NT prefix.
You can use the settings panel to monitor incoming events if you enable the Event Monitor with the "Live Pulse Streams" switch. The monitor is only used to show incoming signals for debug reasons. It is not required to enable the Event Monitor. The live sync is working anyhow. - You can now open the cycle scanner for the connected symbol by clicking the "Open" button.

A new page will show up. You just need to enable the stream via the switch "Live Pulse" on the top of the screen. From now on, live data will stream onto the chart when a new bar has been closed in your local charting app. The cycle analysis will automatically be updated. So all active cycles and the spectrum pot will refresh automatically with new data coming in. - Enjoy your live connection between your local app and the cycle scanner app!


Downloads
Download the pre-build scripts for your platform as attached files to the article.
TradeStation:
WTT_CYCLE_ANALYSIS_APP_STREAM_V2.ELD
NinjaTrader NT8 (64bit):
WTT_CyclesApp_DataStream_NT8_Indicator_v2.zip
( requires Newtonsoft.Json.dll )
Limitations
Current limits:
Analyst Level: 5 running live streams
Pro Level: 20 running live streams
3rd Party Integration
The integration is based on the cycle API data stream endpoints. Data stream integration can be performed for any application using the Submit Stream Data API endpoint. The deployed scripts use this endpoint to provide integration for NT8 and TradeStation - you can review the deployed and attached open scripts to see how this endpoint is used to synchronize both platforms. Please read the API specification.
MotiveWave Integration
Cycle Analysis for MotiveWave Platform
We provide support and cycle tools integration for the MotiveWave charting platform. The MotiveWave FREE Community Edition charting software has high quality charting, Replay Mode & built-in trade simulation.
You can download the MotiveWave Community Edition here.
The following WhenToTrade cycle indicators are support and included:
- Dynamic Cycle Explorer
- Cyclic-smoothed RSI
- Cycle Swing Indicator
Please go to the download page for registered clients here: Download the script package
The MotiveWave add-on integration is not part of the FSC cycles app subcription.
TradingView Integration
The integration provides a back-to-back integration between your TradingView charts and the cycle analysis toolset. Allowing to keep your TradingView chart data synced in real-time with the cycle analysis API and cycle application. Allowing to monitor active cycles in your TradingView chart for any symbol and time-frame.
The first step is to setup a separate alert-condition via a new pine script and attach it to your chart you want to use for cycle analysis.
1. Create alert-condition
Create a new individual alert-condition via a custom pine script. The simplest way of alert-condition for a pine script looks like this:
//@version=4
study("WTT_DataFeed")
plot(close)
alert = true

msg = "{\"streamid\":\"YOUR-STREAM-ID\", \"messagetype\":\"UPSERT\", \"dates\": [ \"{{time}}\" ], \"values\": [ {{close}} ] }"

alertcondition(alert, title='data', message=msg)
Be aware that the text string YOUR-STREAM-ID within the msg variable will be replaced later when you setup the alert. This is just a new alert-condition we place on your chart. This is not the alert. The message object (msg) is already prepared to work with the cycle analysis endpoint. So don't change this message if you want it to work with our cycle analysis.
2. Open symbol/chart
Open your symbol on a TradingView chart. Select the required time-frame and place the new script on the chart. You can use the pre-build script down below and can link it to your favorite indicators.
Want to place this script on your TradingView chart? Just use this prepared script:
https://www.tradingview.com/script/FTEsZurP-Cycle-Analysis-WebHook-API-Integration/
3. Get Cycle Analysis API Key
Before we start the alert and connection, ensure you have your cycle analysis API key at hand. You will find your API key via the cycle application: https://cycle.tools/account/api
Note down that key as you need to enter it when you setup the webhook connection in the next step.
4. Activate the webhook
The "Create Alert" function from TradingView panel will activate the webhook on their servers for your symbol and time-frame:
![]()
To start the live sync, the web-hook will be activated via the alert activation from the TradingView alert panel. Ensure to select the following options as shown:
- Condition: "WTT_DataFeed", data
- Options: "Once Per Bar Close"
- Expiration: Open-ended
- Alert Actions: Webhook URL
- Cycle Analysis Webhook URL: https://api.cycle.tools/api/Stream/SubmitStreamData?api_key=YOUR-KEY
- Message: Replace YOUR-STREAM-ID with the name you want to see it in the cycle analysis tools
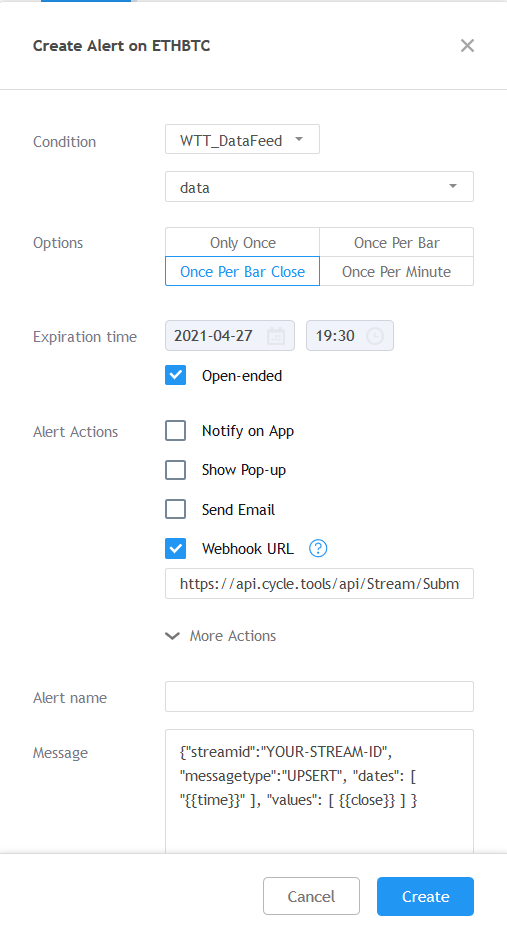
Before you create the alert, replace the YOUR-STREAM-ID tag in the Message section with the stream ID you want to see that in your cycle analysis platform. Also replace YOUR-KEY in the webhook URL with your cycle analysis API key.
5. First webhook activation
After activation, you will see a confirmation in the alert panel that this webhook has now been created. Before we move on to the cycle analysis, we should wait and ensure that the first webhook has successfully been fired. We can see this in the alert panel when a date/time information has been placed in this section below your alert:

6. Open Cycle Analysis Streams
Now, you have done everything required on TradingView. The webhook will continuously fire off, even when you close and change your chart configuration. We can now monitor this symbol in our cycle analysis environment to see the cycle detection for that symbol. Open the cycle analysis streams page to see your new symbol added.
Go to the following page to see the connection: https://cycle.tools/settings/streams
In this case, we named the symbol "TV-BTCUSD-5M" - and you will find it with this ID in your cycle analysis streams board:

After you have setup the connection, there is not enough history available to start the cycle analysis. Therefore you either need to wait until at least 100 datapoints have been fired from the webhook connection or you can backfill the series manually via the "Fill" button and upload CSV data.
Market Pulse
Market Pulse Section of the cycles app
Configuration & Limits
The Market Pulse sections allows to add, remove and sort your symbols in clusters.
The following limits apply based on subscription level:
| Subscription | Max Clusters | Max Symbols per Cluster |
| Basic | 5 | 5 |
| Analyst | ∞ | ∞ |
| Professional | ∞ | ∞ |
Cycles App FAQ
FAQ
A list of important settings and configurations to have a smooth user experience with the cycles application
My cycles app web browser window becomes unresponsive on certain pages from time to time. What can I do?
The cycles app requires a permanent connection to the cycle cloud services. Local browser configuration might be different and might put browser tabs into a "sleep" or "power saving" mode automatically. This causes the connection between the cycles app browser tab and the cycles cloud services to be disconnected and might result in an unresponsive state when getting back to the cycles all browser tab. To avoid this behaviour, you need to change the settings of your browser to register our cycle app URLs. The settings for Google Chrome are shown below. Configuration in other browsers might be similar.

Live Webinars and Private Collaboration Room
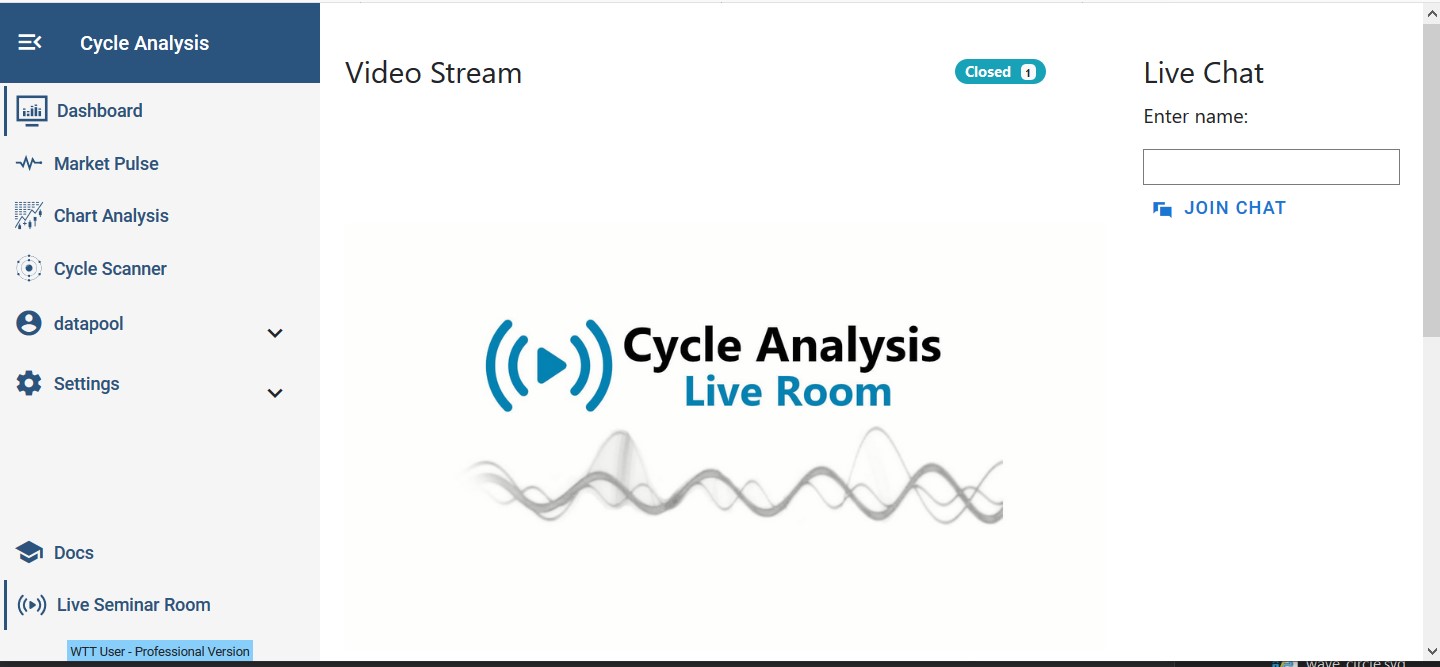
Our Live-Room webinar area allows us to host and run private and secure online webinars with video live-streams and live chat. To ensure the content and discussion within the cycles community is kept private and secure.
You can enter the room within the Cycles Application via the menu "Live Seminar Room" or via the URL: https://cycle.tools/liveroom
The documentation and the functions in the "Live Room" area are continuously being expanded.
Live Inside Webinars - Save the Date
The monthly WhenToTrade Inside webinar is hosted live on the last Saturday of every month at 20:00 CET. Please join the live room to interact live with the speaker and the audience.
The live session will be available as a replay on the weekend following the webinar until the upcoming Monday. Live interaction is only possible during the live session.
HD Video Stream
We provide a high quality HD live video and audio stream in 1920x1080 (1080p HD). It will require ~3.5 Mbps available bandwidth/speed on your end to ensure a stable and smooth video experience without interruptions. In case the video might freeze, check your bandwidth and/or just refresh the browser to stay in the session.
Change Log
Version 1.5 - 28 Jan 2021
- New Feature: Live Webinar room to host private live inside webinars
- New Feature: Share interactive workbooks with colleagues and guests via short invite URL (Analyst or Pro)
- Cycle Scanner: Added new indicator "Composite Energy Model" (available via advanced settings)
- Data Upload: removed the upload limit of max. 20.000 bars for private datasets on Analyst and Pro level
Version 1.4 - 03 Oct 2020
- New Feature: Live Streams Pulse to connect any 3rd party app in realtime with the cycle analyzer (read the docs)
- Backend: Upgraded for improved front-end responsiveness on the user interface
Version 1.3 - 27 Aug 2020
- Datafeed: Added weekly option for Yahoo datafeed, add -W to the symbol code, e.g. ^GSPC-W:YFI (see datafeed page)
- Cycle Scanner: Added range selection to load more data
- Cycle Scanner: Added Savitzky–Golay filter as optional pre-processing smoothing filter and as individual API function
- New Feature: Cycle Skew can be used for cycle analysis and composite cycle plots (read docs)
- New Feature: Cycle Power Spectrum with Spectral Averaging as alternative to Amplitude Spectrum (read docs)
- New Feature: Save Cycle Scanner configuration in two profiles P1 and P2
Version 1.2 - 01 July 2020
- Cycle Scanner: Added new "eye" button to hide/show out-of-sample price data
- Cycle Scanner: Added in-sample button to (re)set in-sample-period to full data range with once click
- Cycle Scanner: Fixed a bug where old cycle selections will not be updated when a new ticker is loaded
- API: Added a API performance monitor screen at https://cycle.tools/monitor/api
- Charting: Added "reverse plot" parameter for dominant cycle indicator
- Workbooks & Snapshots: Added sorting by name and/or by snapshot date
- Datafeed: Added weekly option Quandl datafeeds (see datafeed page)
Version 1.1 - 22 May 2020
- New Feature: Added new Workbooks feature to save Cycle Scanner configuration and composite cycles
Version 1.0 - 19 May 2020
- New Feature: Release of online documentation at subdomain docs.cycle.tools
- Update: Cycle Scanner - "Active Cycles" table with scrolling instead of paging
- Update: Cycle Scanner - Selected cycles for composite plot shown in header
- Upgrade: TradingView charting backend upgraded to Version 1.15
- New Feature: Integrated datafeed wrapper to pull data from yahoo finance
AI Reports
Steps to use the AI Reports feature
- Ensure you are logged in with you FSC account to in a browser tab
https://chat.cyclesai.org/ - Open and create your cycle analysis chart first in the FSC cycle analyzer
Select 1-x cycles to build and activate a cycle composite overlay - Active the cycles RSI pane to be shown on the screen
- Go to the menu and select the entry "AI report"

- A new tab will automatically open where the report will now be generated live. Be patient as the agent will start to write your report. It might take up to 5min in some cases.
- You can download the generated report with the button at the bottom in markdown format to save the report.
- The markdown report will include more details as on the screen. You can see what the agents produced upfront as background research for the chart before the report has been summarized.

Beta test rules & guidance:
- Do not produce more than 1-2 reports a day!
- Your feedback should focus on what is wrong or seems not to be right in the text summary regarding your individual summary. Your feedback at this time should not focus on "improvements" or new feature requests. The feedback should only focus on improving the quality of the written summary.
- Put feedback to the MWG slack channel what you think could be improved and what the agents currently might not do right. Slack channel for feedback:
https://fscmasterswor-vut6666.slack.com/archives/C092H9NNEQ2 - We do not guarantee this feature to work. It could be taken down at any time.
- Don't expect support for this beta feature.
- You are not allowed to use the AI report feature to generate content for distribution outside the FSC MWG community.